Category Archives: Scientific theory

Natural Pattern Languages

key organizational elements for the working relationships of complex systems
ideas of complex relationships that fit the reality

We care because of the new bridge it creates between human ideas and the working organization of complex working systems we make, use and need to respond to of all kinds, an emerging broad advance in understanding complex system organization design.  The idea of pattern language, invented by Christopher Alexander for architectural design in the 70’s, actually started blossoming some time ago, it a most surprising place, in the creation of complex design concepts for computer programming known as “object oriented design”.

As it continues to expand and mature it is becoming a wonderfully versatile method for sharing and recording expert understandings of “how relationships work”, with application to almost any fields.   It became the basis of modern computer programming, as “object oriented design“, with each object fulfilling a “pattern of relationships” that connects with others.   For me… its a language I can begin to use to translate my research on natural system designs into, into “JPL” (aka Jessie’s Pattern Language), for subjects such as how natural systems transition from “type-r” to “type-K” behaviors (a subject underlying much of the discussion on RNS of complex system successions,life stages and cycles,”dual paradigm views”, “organizational stage models”, as observable patterns of organized change in relationships).

The reason it works for “object oriented” programming and “natural systems science” and in other areas too, appear to be the same.   Pattern languages let people use their considerable natural understanding of complex relationships, like “home” “friends” “communication” “trust” “patience” etc. to open our eyes to similarly complex working relationships and meanings of complex systems elsewhere too, as “designs”.  The standard “design pattern” of pattern languages connects human relationship concepts to working organizational relationships of behavioral systems  of ANY kind.  That seems to be why the design model that Alexander invented turns out to be so adaptable to our needs in our now overwhelmingly complex new world…!   ;-)   I can see it readily becoming applied to breaking down the silos of separation between knowledge disciplines, too, the so called “blind men and the elephant problem”, something just completely unimaginable in reality today.

Pattern Languages are for

1. identifying key organizational elements in systems of complex relationships, found in nature or in design practice,

2. communicating design elements for complexly organized systems or illuminating them in existing natural or manmade ones.

3. using the design pattern to refer back to the original natural forms and contexts from which it originated or is used to represent.

Two natural system design patterns, (for example):

Moving with the Flow

Sometimes you watch the people, sometimes their flows.   The flows are roles in larger scale systems of group motion, forming as people avoid interference, but can confine them till they find an opening too.   Markets flows form paths and break from them as new paths are found, often flocking in chase of a wave of anticipation, or uncertainty moving leaderless floods.   Those are puzzling, since there may be no news the contagious change in direction, but systemic change generally usually has a real cause.    Flocks of birds appear to do it just for fun though.


Alternating roles that Fit

Both natural and human designed complex  organizations have independent parts that create emergent properties by fitting multiple roles.  Day and night, male and female, work and relaxation, pencil and paper, cup and liquid, all the amazing polarities that produce reliable results because of how they fit their multiple roles, quite unlike any set of fixed rules could ever do.  The trick is only physical parts and their relationships can do that, and a pattern language those relationships provide a way to develop concepts for understanding the working parts.


There are many types of Natural Pattern Languages, generally depending on the organizational medium (material and environment)

  • Social organization pattern languages
  • Natural system pattern languages
  • Architectural and Urban design pattern languages
  • Cultural pattern languages
  • Abstract Scientific pattern languages
  • Educational pattern languages
  • Computer knowledge design pattern languages
  • Commons & community design pattern languages
  • Economic pattern languages
  • Movie making pattern languages
  • Organizing pattern languages
  • … etc.


There are three uses of the term “pattern language”,

1. As the collection of design elements and patterns used to design or describe working complex systems

2. As an the organizational language of an individual design project describing its working relationships as a whole

3. As a property of an individual complex system, consisting of the working relationships between its parts and its environment, that might be view from various perspectives to recognize different elements.

 So they’re simple conceptual models designed as versatile tools for engaging our minds with the actual working organization and relationships of natural and designed complexly organized parts of our world. So they come in those two basic forms, as Design Patterns one uses to guide the implementation of some plan or as Natural Patterns used to help people understand how designs can fit in with natural organizations.


Pattern Language sites

_____________________

jlh

“Dual paradigm view” Can ecosystems be stable?

Reposting a November 25, 2014 at 4:46 pm comment to Quanta on the Tracy-Widom New Universal Law article

This is a simple way to demonstrate the “dual paradigm view” as a bridge between the abstract complex systems theory and direct study of individual complex systems, to advance our understanding to of the mysterious phenomenon of “emergence”.  The article suggested that as statistical systems ecologies generally could never be structurally stable, but did not compare that to systems that rely of “accumulative organizational design” particularly those with “learning parts” as ecosystems systems so often to have rather than “correlated random variables”.   The moderator clearly liked this better than my first response not published.  

The “dual paradigm view” addresses the dilemma of complexity science that computer models are fine for theory, but don’t really let you study nature.  That’s what a way to connect mathematical systems theory with individual systems study addresses.   Much of my work of the past 35 years has been on that subject, now recently raised by David Pines’ in a founder’s article for SFRI Emergence: A unifying theme for 21st century science, saying that physics and complex systems science now need a way to study the physical phenomenon of emergence and actual complex systems to progress.   My reply to his article  Can Physics Study Behavior not Theory, was first posted on Medium.

It’s interesting that with such a number of cross connecting areas of physics being discussed, the ultimate finding technically didn’t answer the initial question posed. That was Robert May’s “question about whether a complex ecosystem can ever be stable, or whether interactions between species inevitably lead some to wipe out others”.

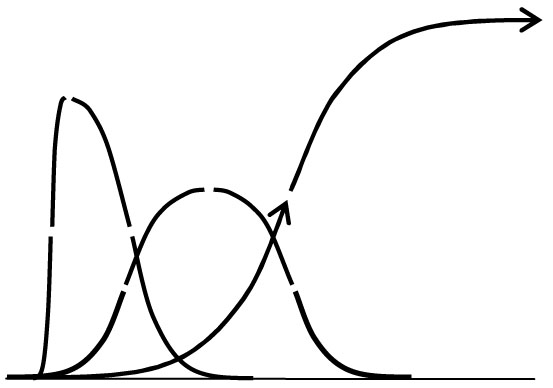
The mathematical analysis of that question and others was limited to “kinds of random growth” and “systems of correlated random variables”. There are also lots of non-randomly behaving systems too is worth considering, and may have been overlooked in answering the basic question. The variety of organizational growth systems that are familiar everywhere in nature display many kinds of growth curves and outcomes, often having an overall appearance of being 1) quite lopsided, 2) quite symmetric, or 3) reaching extended stable states.

note: How the meaning of probability distribution curve shapes (as discussed in the article) differs from the meaning of these individual development curve shapes was skipped in this short comment on the article.  Please do bring it up of course if needed.   The question posed was about the development of individual ecosystems, and their potential structural stability.

 Generic common curve shapes
for the development of organizational systems.

We probably know of lots familiar examples of these from personal experience, where the systems involved are going through progressive organizational change during their periods of acceleration or deceleration. Reversals in curvature don’t always reflect systemic changes in direction for organizational development, but often do though (shown as gaps in the diagram for raising those questions).

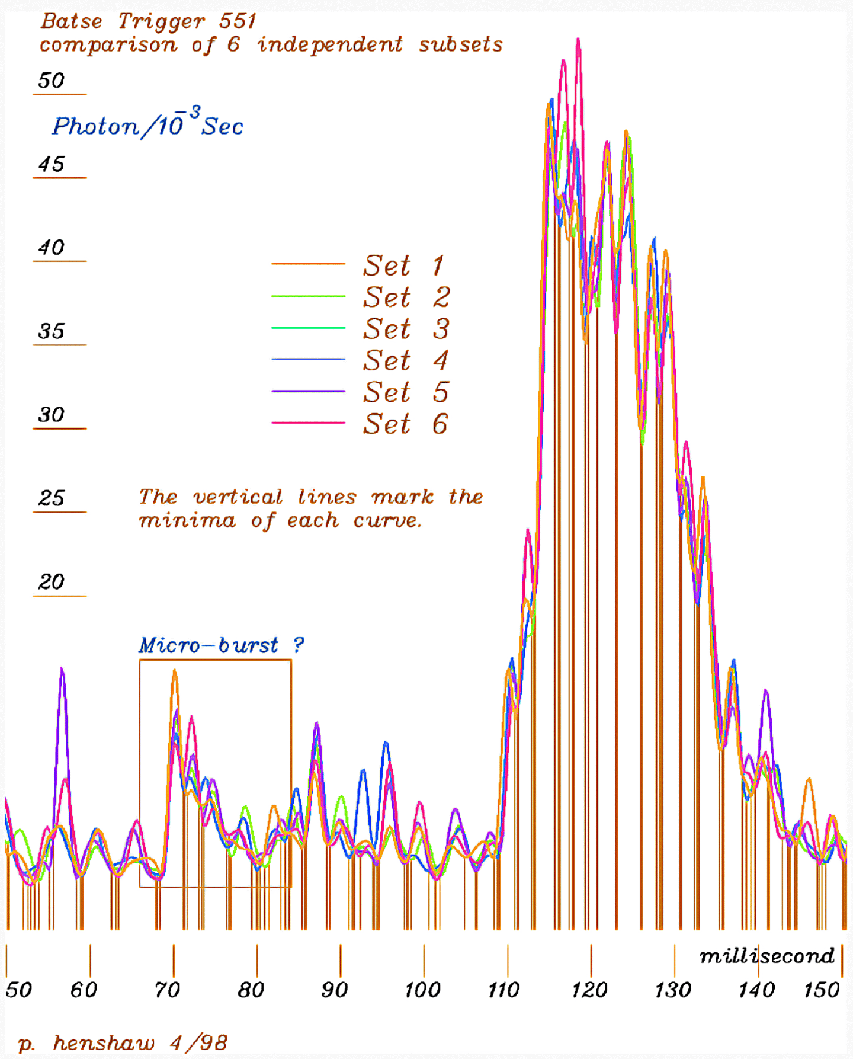
The one looking like a TW distribution curve is familiar to all economics and other matters, as a “meteoric rise” followed by “immediate decline”, like many a seemingly fine business plans might experience. The quite unusual thing is this same shape turns up in Gamma Ray burst records too (see image of BATSE 551 #1 below). It raises the question of whether that system (presumably of radiation from black hole collapse) reflects the organizational stages of a system that experiences a “blows out” (like some of our best business plans do) or that of a statistical distribution for correlated variables, or something else?

In any case, just asking that raises the possibility of a bridge between TW correlations and the fates of natural system organization designs, and perhaps a need to consider whether the other kinds of system are available to change the outcome for May’s ecosystems, depending on their design.

Gamma Ray Burst “BATSE 551 #1”  – Raw data dynamically smoothed.

( reposted from the Pattern Language Debategraph

________________
jlh

But how can physics study behaviors, not the theory?

On @SFIScience David Pines, Co-Founder of the Santa Fe Research Institute wrote Emergence: A unifying theme for 21st century science, describing a critical need for physics to develop a way to study “emergence” directly, as a natural phenomenon, not just a theoretical models.  This article reposts my reply to him on Medium: But how can physics study behaviors, not the theory?

For understanding the emergence of new forms of organization in nature, the study of theoretical models seems not to be yielding the kind of useful understanding we so critically need now.   What I introduce is a”dual paradigm view”, to address the dilemma, a better technique for learning from nature directly.  Computer models are fine for testing theory, but need to be used differently to help us follow the continuities of nature.   There is a very big conceptual hurdle, getting mathematicians to study the patterns of nature directly…   The physics based method I developed, using models of probability to help locate individual developmental continuities offers a direct way to address the problem Pines raises.  It could genuinely offer complexity science a better way to study their actual subject, and couple their theories to actively occurring emergent processes and events. Among other discussions of it on RNS Journal:

a”Dual paradigm view” Can ecosystems be stable?,
 Finding Organization in Natural Systems – “Quick Start”
– 
Can science learn to read “pattern language”…?
 In two words… what defines “science”?

– ‘Big Data’ and the right to human understanding.
– What is a “rights agenda”, with ever increasing inequity?
 Sustainability = growing profit then steady profit

Emergence is what we see from cosmic events to the flocking of birds…


David Pines makes a very intelligent assessment, saying in part “The central task of theoretical physics in our time is no longer to write down the ultimate equations, but rather to catalogue and understand emergent behavior in its many guises, including potentially life itself.”

I was one of those who figured out why that would become necessary back in the 1970’s. The behavior of complex systems of equations that permit true emergence will not be knowable from the equations. It’s not just their complexity, but that their emergent properties are emergent and dependent of histories of development rather than being formulaic.

I have also been writing papers and corresponding on the problem very widely since then, and really wondering why I was so unable to get systems thinkers, from any established research community to join me, in studying the commonalities of individual emergent systems. I started with air currents, that generally develop quite complex organization quickly with no apparent organizational input, behave very surprisingly, and seem individually unique.

I actually developed a fairly efficient scheme for studying any kind or scale of emergent system, using the simple device of starting with the question: “How did it begin”. What starting with that question does is immediately shift the focus of interest to considering systems as “energy events”, that you consider as a whole in looking for how they developed. That approach also directs you to look for the event’s naturally defined spatial and duration boundaries, which are highly useful too.

In addition to being fairly productive as research approach, it also made it easy to skirt lots of spurious questions, like “how to define the system”. With that approach your task is finding how the subject defines itself, still looking for a pattern language of structural and design elements to work with, within and around the system, confirming what you think you find.

What I finally arrived at in the 90’s was that the equations of energy conservation implied a series of special requirements as natural bounds for any emerging use of energy. I was thinking that the issue was how nature uses discontinuous parts to design continuous uses of energy, and in working with the equations noticed that the notation for the conservation laws were either integrals or derivatives of each other.

Then one afternoon I just extrapolated an infinite series of conservation laws to define a general law of continuity, and integrated it to find the polynomial expansion describing the boundary conditions for any energy use to begin. It was a regular non-convergent expression, a surprising confirmation of Robert Rosen’s interest in non-converging expressions for describing life, and became very useful as what to look for in locating emergent processes to understand how they worked. I circulated the proof for discussion many times, submitted it for publication a few times and wrote numerous introductions, the following the most recent:

Continue reading But how can physics study behaviors, not the theory?

Can science learn to read “pattern language”…?

This post is a section of my report titled “Approaching 30 days from the 40th Anniversary” on attending the quite exciting 2012 40th Anniversary meeting on the Meadows and Randers authored Club of Rome “Limits to Growth” study.   The excerpt is on the deep reasons why the science, as solid as it still seems to be, isn’t widely accepted.    Science is still struggling to find a comfortable way to discuss natural systems whose innovative systems are housed internally, and so largely hidden from view.

___________

I think the real reason the public as well as most of the scientific community is largely ignoring the rather well established hard limits to growth, is that it presents the scientific community a new problem it hasn’t yet learn how to deal with.   It has yet to find a good way to make sense of self-designing and self-managing systems, like weather systems, cultures and economies, that have working designs that are  hidden internally, displaying organization much too complex and localized to be determined by external forces.

Science is built around identifying how one thing controls another,
not how to study the  patterns of uncontrolled systems and how they became designed to work by themselves.

So science is naturally somewhat lost in discussing how they work, having no model for what are better described as “opportunistic” than “deterministic” systems.   Though both climate and economies display highly inventive systems, they do still necessarily operate within what traditional science can define as their natural bounds.     Climate is still fundamentally a complex pressure-temperature behavior, of unchanging deterministic processes following fixed laws of science.

Economies though, are able to be far more creative, and move the boundaries of what is possible by innovative design, much further than the push and pull forces of the weather can.   It has given traditional science very little to anchor reliable theory on, except as in the Limits to Growth study, fixing boundary conditions and experimenting with multiple options.  Still, because economies do display deeply creative behavior, constantly inventing new ways to use energy as a normal rule, that natural science still lacks a widely accepted way to study them as natural systems, adds uncertainty for others to what anyone might say about them.

Constantly inventing new organization is just what natural systems ‘do’.   It lets economies as well as ecologies create new kinds of organization and uses for their energy resources, making formerly useless things highly profitable often enough.   Using the profits as returns on energy investment to grow by building more innovations.   It’s complicated by not being a ‘numeric’ process, though we can see it through our measures.   It’s an “organizational process”, of fitting complementary parts together, more amenable to study as a “pattern language” of “design elements” than equations.

The rigid limits of any mode of productivity still do exist, of course, but as limits of the organizational processes science has yet to find a way to study.   Those limits are still determined by the earth and the organization of the internal and external systems that any innovation depends on, but with each new innovation there are new unknown limits.  It leaves a stubborn problem for traditional scientific prediction.   What seems to work better is a language of observing such systems to see when their own organization is being stretched.

Natural systems generally link individual units of organization in an open rather than deterministic environment, each with its own internal organization that emerged during its own development, creating a serious mis-match between the natural design and the information an observer could collect, and with the kinds of behaviors that can be emulated by equations.

That big problem for science also makes a big and very fascinating subject of study, that science has quite generally not realized is there, having avoided the study of self-designing and managing systems in general.    Self-designing ans managing systems not only seem to develop by themselves, but to have their “works” hidden internally within the boundaries of their design, as an individual system maintaining internal organization for responding to external systems, like we see in living systems as a special case in point.   Continue reading Can science learn to read “pattern language”…?

a Whole Systems view – Piketty’s “r > g”

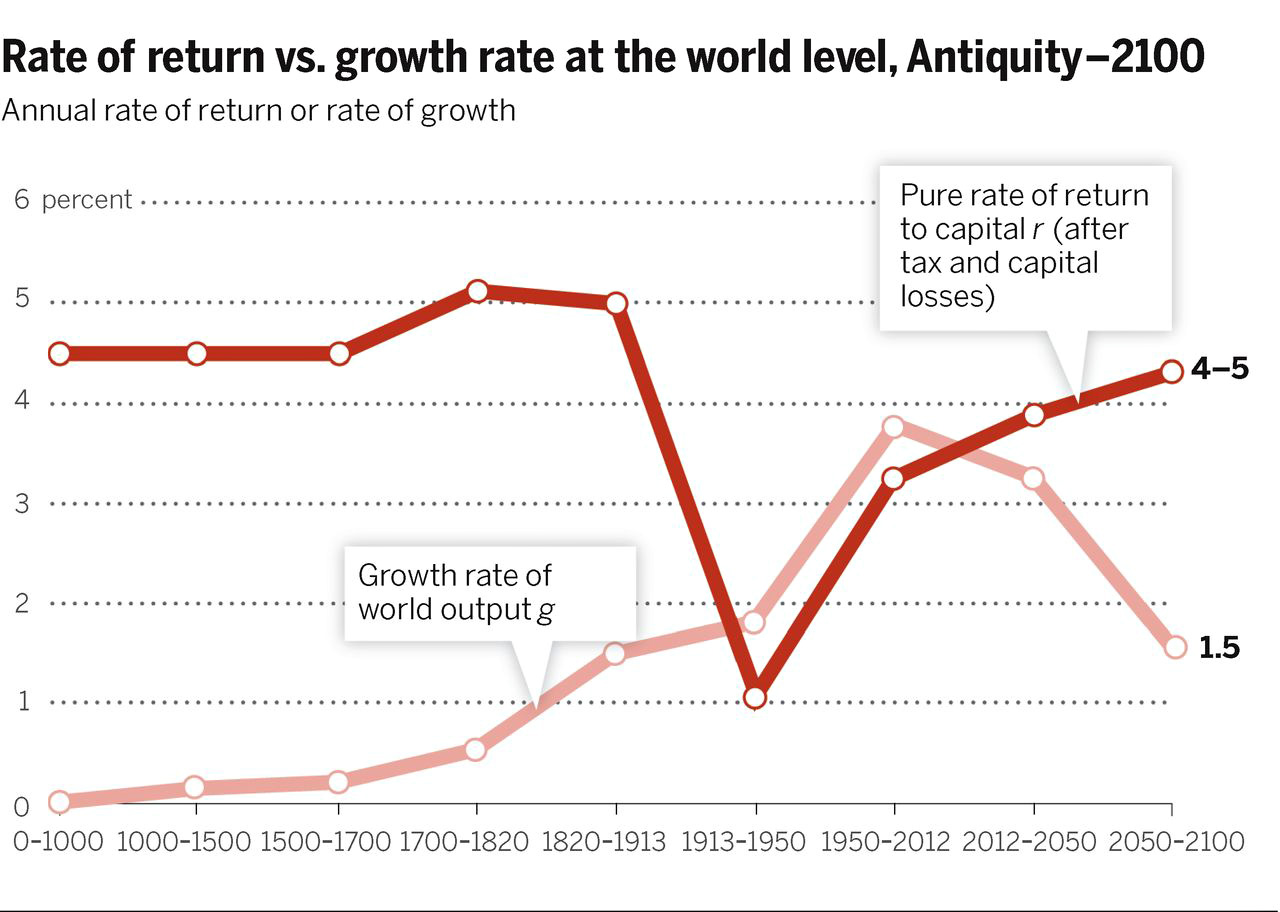
A wide and welcome discussion of our economy’s tendency to produce increasing “inequity” has followed the US publication of Thomas Piketty’s book, “Capital in the Twenty-First Century”, and offered me many chances to comment for general readers with interest in the deeper scientific questions.   I think my best so far were my most recent two, for the special issue of the AAAS journal Science on “The Science of Inequality.  It’s really great to now have this chance to discuss the core dilemmas involved.

I hope not, but more or less expect, this opportunity to “come and go” without much consequence.   That’s happened over and over, for a very long time.   I’ve been watching it come up again and again for the past 40 years, and seen how each discussion fails to get to the heart of the issue, and have looked into the long history of “great debates” around it going far into the past.   There are just clearly very deep conflicts between “how we think our money should work” and “how our world apparently works”, that are still with us.  Science should be our tool for solving such problems, but hasn’t.    So it seems we won’t get to the bottom of it until we find the right language to discuss it in.    I think the language of natural systems is what will do the trick eventually, starting with “growth” being nature’s “start-up” plan and design for the invention and development of new types of systems, so the subject of what’s happening to our growth system is a good place to start.   Let’s see!   :-)
_______

Comments on Piketty’s inequality, “r > g”   

For: – Science,  the Financial Times, the Economist, New Yorker, Capital Institute, the Guardian, Salon, Piketty in ‘The Bully Pulpit”

 >>   Returns on investment seem to outpace the Growth of the economy   <<
(..    so incomes from wealth and work ..   d i v e r g e    ..)

The true reason seems to be our long habit of maximizing growth ** measured as ** maximizing returns for re-investing  …particularly now… when growth is pressing natural limits, and meeting natural resistance and complications that increase faster the harder we press them.    What we need is to understand that turn of events.    JLH

_________

Comments to the press:

I. on Inequality in the long run by Thomas Piketty & Emmanuel Saez; in the Special Issue on the Science of Inequality, Science magazine – Comment 5/28 link

As with the “Occupy Movement” the diagnosis of the problem here is really wonderful.  And for me it is VERY satisfying that someone finally found a way to raise an actually serious discussion on it.  I’ve also been studying this phenomenon, as a natural systems scientist, for 30+ years though.  So as much as I am really delighted to again hear  the complaint being well expressed, as  “Occupy” also did, I don’t yet see a move toward the level of understanding needed to point to feasible (win win) solutions for it.

One step in that direction would be a discussion of how investors change what they invest in.  This is a “system” after all, and we need to look at how it works. Buy using the profits from a “good bet” to multiply good bets you change the odds, by physically changing the environment being bet on.  That also naturally concentrates unequal wealth, in the hands of investors using that leverage to multiply investments.

Historically that seems at the very heart of all financial manias, like the kinds that develop before great panics and crashes.  The rub is “multiplying sure bets” does almost nothing more certainly than “create bad bets”. That prefer to believe in the manias, though, instead of the obvious is part of the emotional struggle and problem. So… we have contradictions here. We’re still talking as the economists long have, of “ever faster accelerating increases in scale and complexity” as a “steady state”.

OK, in a theoretical world that’s OK.  But here the discussion of “inequity” poses a problem of unfairness, regarding having “unequal shares” of what we now also see is “ever increasing instability”. That’s not ‘OK’.  ;-)

II. on Physicists say it’s simple by Adrian Cho; in the Special Issue on the Science of Inequality, Science magazine – Comment 5/27  link 

Physics is certainly the right tool for this, but you need a technique of getting the universe to slow down tremendously, to let you see how the seeds of swelling inequities emerge and what they lead to. I did that on the way to developing a new physics theorem, that I hope will soon to be widely studied.

The theorem unifies the conservation laws to offer a general “law of continuity in change”. It doesn’t say theories can’t have discontinuities, only that uses of energy can’t, while pointing quite directly to nature’s marvelous “approximation to discontinuities”, her way of multiplying inequities on the way to precipitating dramatic changes in form in the organization in her complex systems.

Unifying the conservation laws shows its important to understand them as an infinite series of conservation laws, for all the derivative rates of change for energy use in physical processes. So as a whole it offers “a law of continuity”. http://www.synapse9.com/drafts/LawOfContinuity.pdf You can simplify the idea of it to saying “it takes a process to change a process”.

To see it happen you watch transitions intently enough to slow down the universe for your eyes, closely examining the steps nature takes to get things started, a fire, an eye blink, a plant, or any other “event”. What you find are little bursts of self-organization, following a non-linear trend most people would call “growth”, a process just full of things happening with a bang.

Growth is a distributed process of multiplying inequalities, is the relevance here. It’s a process of continually swelling inequities throughout a system, an explosion of increasing energy use, complex organization and change, that invariably triggers its own change in form. Where I first got the idea was by training my eyes to slow down the flowing changes of natural air currents, so I could watch “what made them so lively”, letting me discover how stable convection cells form from the instability of growing ones.http://www.synapse9.com/airwork_.htm

So, inequity is a natural byproduct of growth, essential to the systems growth builds, and as a process naturally leading to a change in form.  In economics one common way for it to first cause growing inequity and then result in stability is by people realizing they’ve built as much as they can manage.  Then they devote their resources to caring for what they built instead of continuing to build till that destabilizes it.

Is that possible for us?? I don’t know, but I think the physics implies we’re sure to find out.

Continue reading a Whole Systems view – Piketty’s “r > g”

Gamma Ray Bursts – dynamics reconstructed

Gamma ray bursts are the most high energy events commonly observed in the universe, associated with the formation of “black holes”, and creating very high energy x-rays.    NASA provides good introductory information with a nice animation.  Satellite instruments easily record the time and intensity of these events but can only rarely connect them a location.    So they’re one of the more mysterious of cosmic events, also common and occurring a few a week.      

This journal entry in RNS updates a very sketchy old record of my 1998 study to demonstrate an “Application of the Physics of Happening” using my powerful new analytical method called “derivative reconstruction“, for exposing the active dynamics of phenomena of all kinds, that may be hidden in noisy data.  It was published with other new techniques in 1999 as Features of derivative continuity in shape, in IJPRAI. 

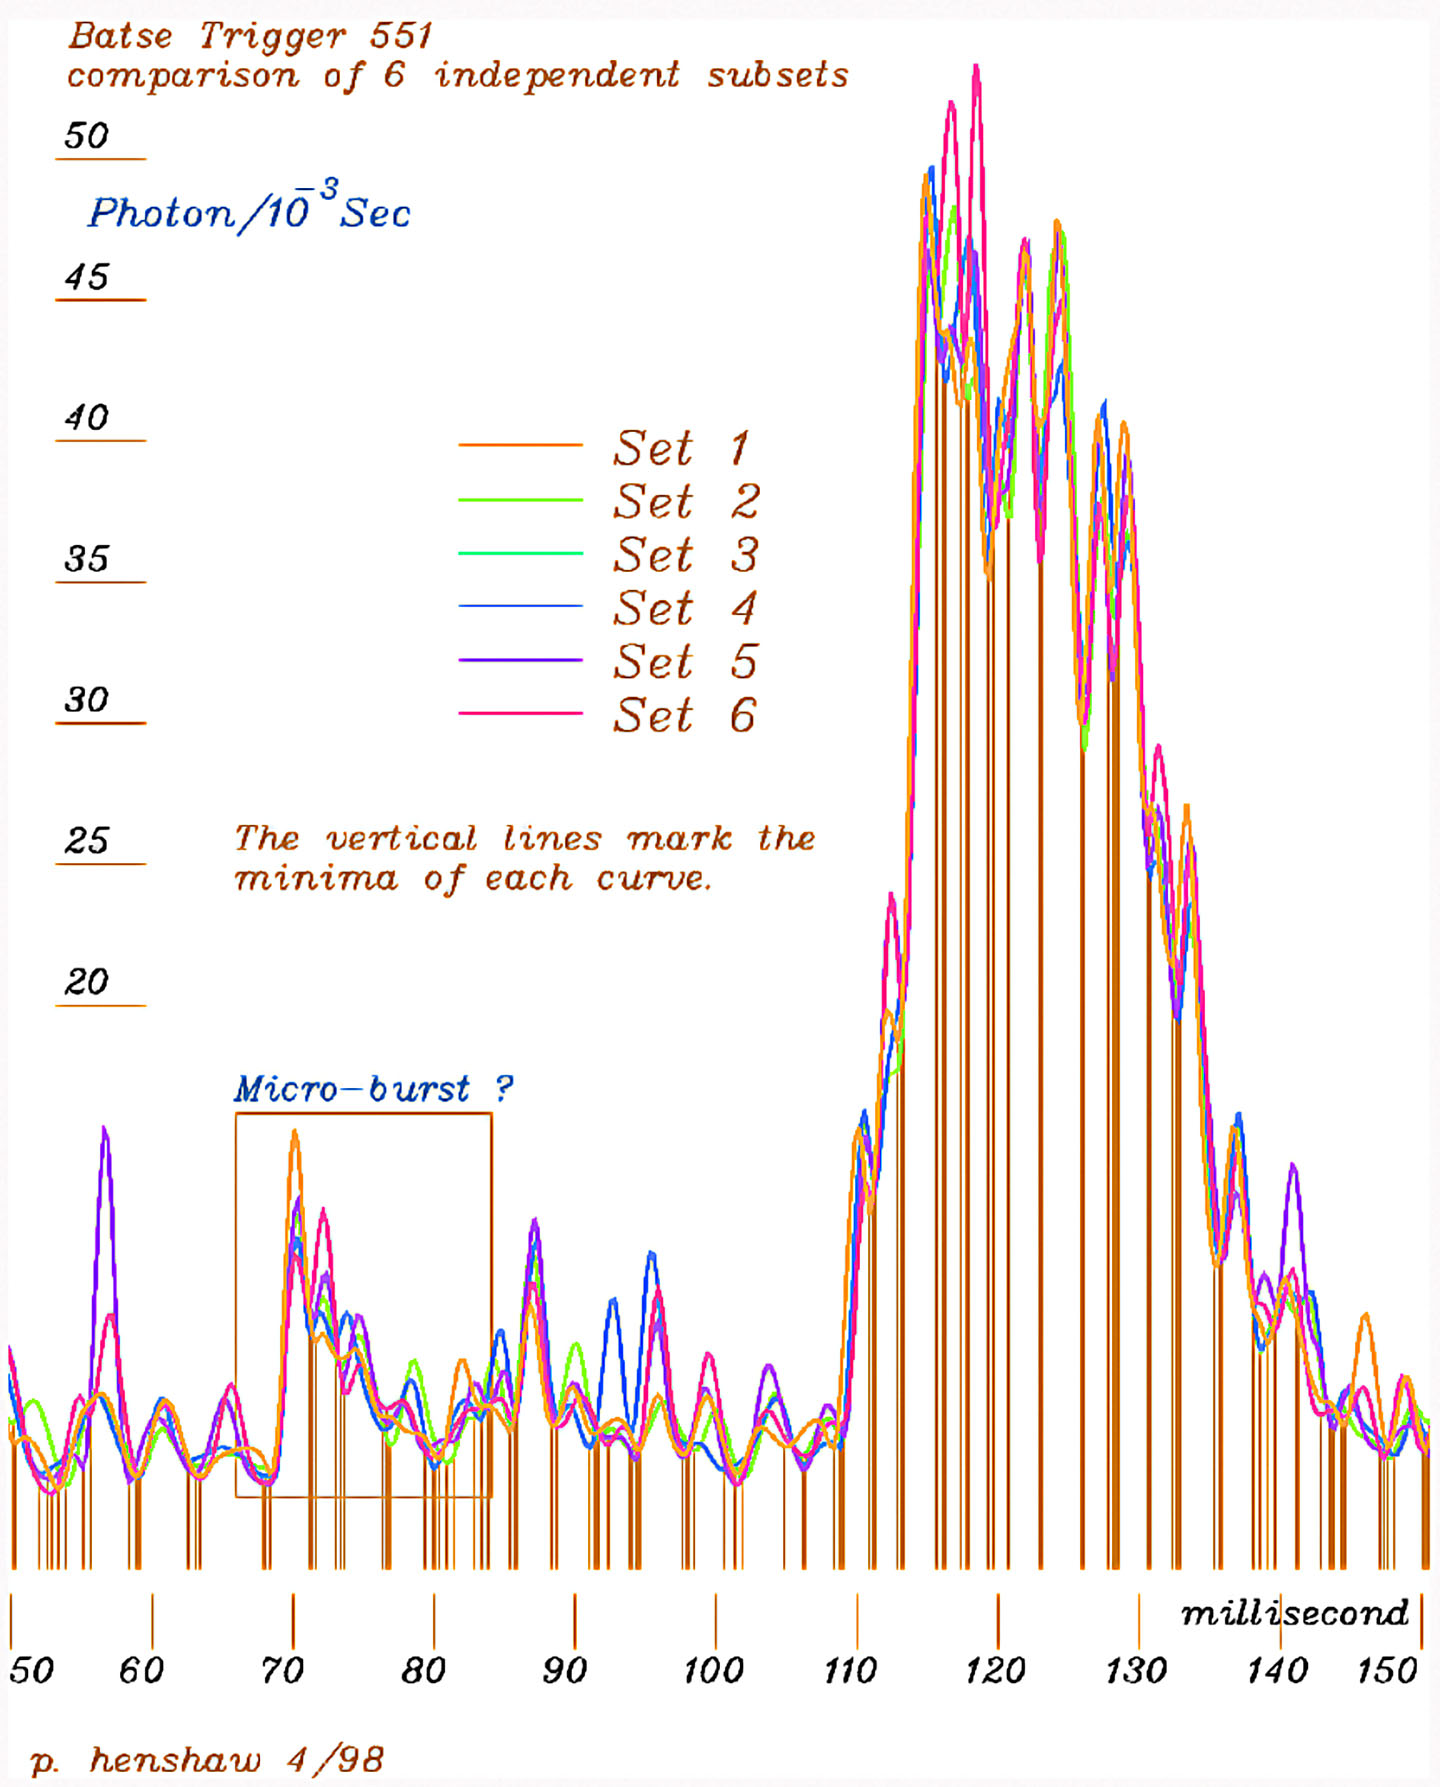
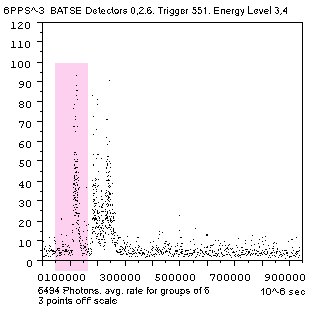
The 1998 gamma ray burst study was of the data from NASA you see in the figure below, called “BATSE Trigger #551”, using the 6494 points recording gamma rays in Energy Levels 3 & 4, chosen for being less noisy.   The object is to reveal the detailed shape of any underlying continuous processes involved, as seen in the second figure.     To date, it seems, gamma ray bursts like this are only understood as statistical events, like “bursts of noise”, instead of as dynamic events with continuous processes .

BATSE Gamma Ray Burst Trigger #551. Energy Levels 3 & 4

You can see below the clear dynamics of the first of the three major burst events in the record, consisting of a sudden rise without evident developmental processes, followed by an abrupt shift to declining by a regular “S” curve progression, of the decline first speeding up and then slowing down.  That connection of two highly differing dynamics is something like the “bursting of a bubble”, with the breach of the containment and the release of the pressure having very differing dynamics.   That analogy may not apply to black holes, of course, but understanding two different dynamics is likely important to understanding what is physically occurring.

Overlay of the Six Subsets of the data, with the 3rd derivatives regulated to expose the implied continuities the same way

The other highly noticeable shape exposed is an apparently fairly regular 3 millisecond fluctuation in the cosmic gamma ray background.    As to whether is a feature of the data or of the analysis, one can see it is both quite regular and irregular enough.  The regularized curves are shown in six colors, each one representing the same derivative regularization applied to a different subset containing concurrent 1/6th’s of the whole data.  The vertical lines mark minima for every fluctuation in each of the regularized subsets. Continue reading Gamma Ray Bursts – dynamics reconstructed

A telling image… money measures our impact

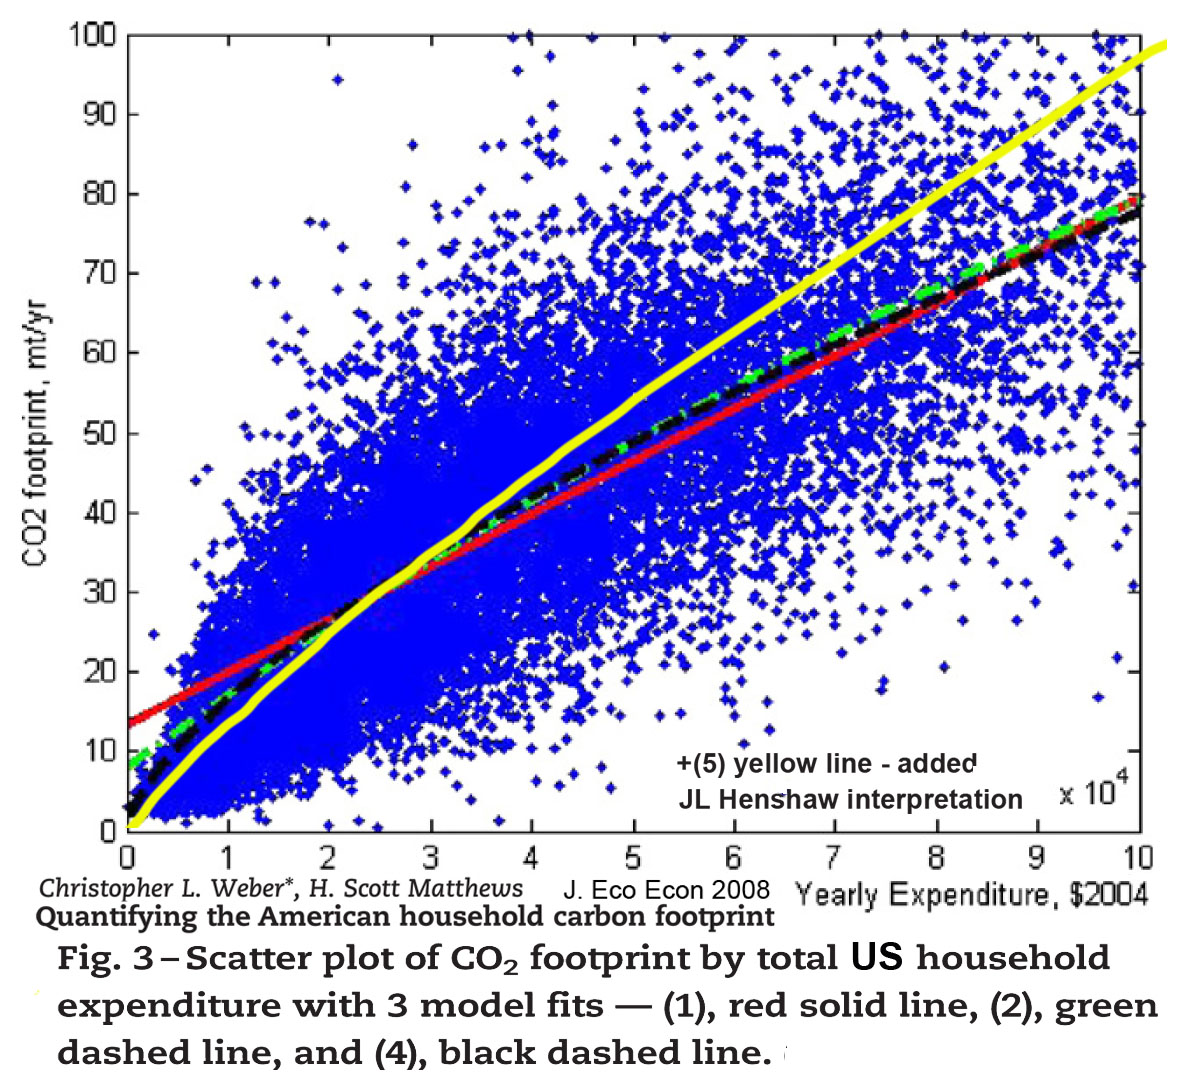
  • A “telling” image… connecting dots:  the distribution of US household CO2 footprints, by income level from Weber and Mathews 2008

The average Co2 intensity is shown as ~1.0 kg CO2/$1 of income (the scales go to 100 tonne/yr CO2 and  $100,000/yr income).   That’s about twice the world average CO2 intensity,  which was closer to = ~ 0.45 kg/$ GDP in 2004, (declining at 1.24%/yr historically).    What it does nicely is confirm one of my most contentious conclusions from the Systems Energy Assessment (SEA) paper and so called “scope-4” assessment.   It shows what it means to use average spending, like household “wages” as a baseline measure of average economic consumption impacts.   Because the slope of the curve is so different from what I expected I think it remains to be confirmed.    The US consumption intensity seems to be about double the world average.   It doesn’t seem right but I don’t know what would cause that.

My interpretation of the trend is the yellow curve, just from the overall torpedo shape. A large poor population could be distorting the regression curves.

In any case, none of these household impacts  being funded by businesses are being counted as impacts of operating businesses by the widely used sustainability metrics!   That disclaimer of responsibility seems mostly to be for historical reasons, though, and for the simplicity of accounting for information coming from different places.  It also shields business sustainability decisions from having to deal with quite the whole problem at first.  Sustainability decisions will later be found to need to deal with it, of course, appearing now to start with a limited task, like a start-up problem, a bike with training wheels.

For the 2010 & 2011 SEA studies of a typical wind farm business plan, we tested what would happen if we were to include this discounted part of the business footprint as having a “world average” CO2/$ intensity.   Our including it increased the total measure of energy and CO2 impacts for the business by 400%, as human services actually proved to dominate this seemingly technology centered business.    With this new information on the US household impact distribution, I’d now need to say US businesses might actually have footprints 800% larger than presently being counted.        

It seems we’re in the middle of quite some learning process!   ;-)

fyi..

___________

jlh

What’s Scope-4 and… Why all the tiers??

The problem that Scope-4 corrects:

Today our measures of business environmental impacts address the size and efficiency of business technology use, traceable from local business records.   We’re not even trying to measure what’s traceable from what a business pays for throughout the whole economy.   So in effect, the global impact is counted within a narrow local boundary, making the measures scientifically undefined, and highly misleading.  Why it matters is that business, investor and policy decision makers then don’t know what impacts their decisions really have, and the research says most of any business’s real impacts are global.   So we need to understand why the world economy seems to work so smoothly.

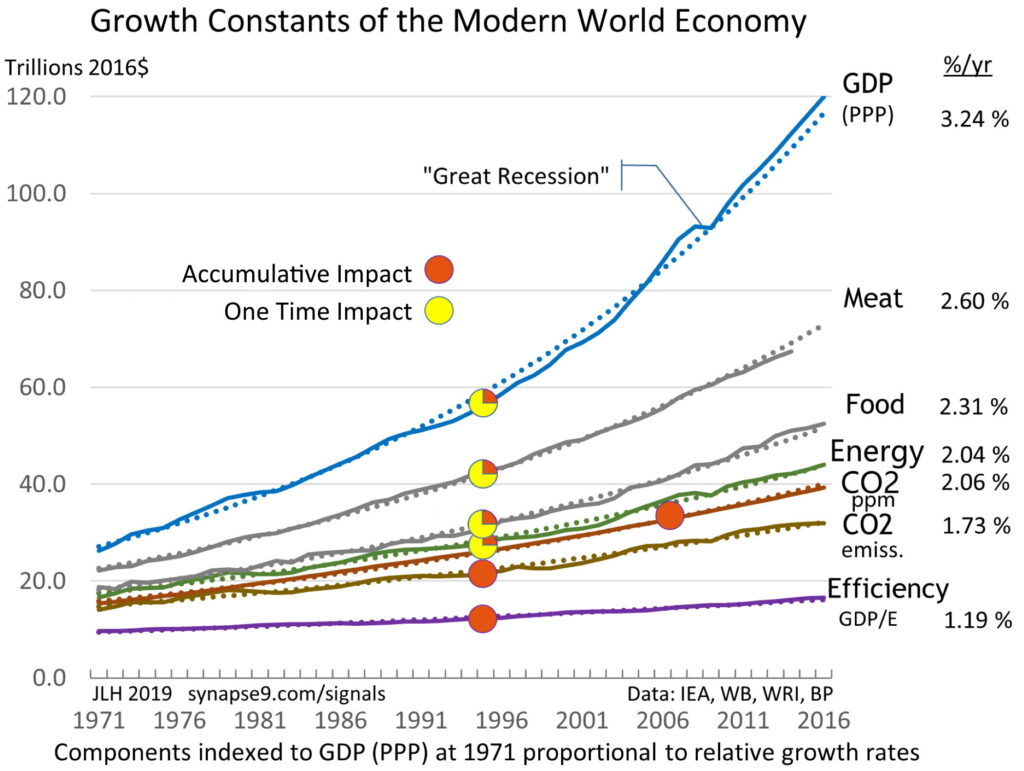
The world economy grows as a whole, as if all parts worked smoothly together, shown since 1970 here, and seems to have for 150 years, hard to imagine but competition seems to assure it, at least for energy use.


What’s counter intuitive for solving it is that the world economy not only LOOKS like a whole system, it also WORKS as a whole system.  What you know is 1) all parts of the economy are supposed to be and 2) seem to act as if 3) they are competitively efficient.   Otherwise 4) they lose their access to energy use, and the energy goes to someone else.   Smooth working competition like that is 5) needed for a world system to work as smoothly as global data shows, and 6) making there no better assumption than that differences from global average efficiency are temporary.    So unless someone can say why not, I think we have to treat energy use as being predictably proportional to GDP.   That’s been peer reviewed as a general principle, that one can rely on the range of local or international variations being likely to be relatively small (maybe +/- 10%) for any globally connected part.   

so…. there’s  a LARGE miss-match

between the effects we see and the ones our money really causes

 ____________

Introduction –

the scientific basis for the SEA-LCA “SCOPE-4” accounting principle,

That: Every dollar spent can be shown likely to pay for such widely distributed services throughout the world economy, that at least as a first assumption, it also pays for an equal share per dollar of the whole world’s economic activity and impacts. In principle, shares of GDP seem to carry equal shares of responsibility for what the economy does to produce GDP
Continue reading What’s Scope-4 and… Why all the tiers??

How full is a “Glass Half Hidden”?

The worst part of “A Glass Half Hidden” is the clear chance of discovering “An Iceberg of Risks” missing from the view.

Scope 1, 2, & 3 only count the impacts of the primary technology chains that businesses rely on to operate, and ignore the usually much larger impacts of the many chains of business services consumed too.   That’s the iceberg of hidden responsibilities of business cause, being ignored due to using an unscientific method of measurement, i.e. counting only the impacts you see, and not accounting for the one unseen (what Scope 4 finally does).    So there’s also a hidden iceberg of bigger than expected changes in plan to take care of too… that we’ve been unaware of needing for having a sustainable economy.    It explains why our efforts so far still result in the economy degrading of the earth ever faster as we delay making meaningful change.   The job doesn’t change, just how directly we’re able to address it.

What’s really hidden is that it’s our money that is directly paying for all the economy’s impacts, making us financially responsible.  Now we also really need to know the total bill.   Having a habit of not looking at what our money was used to pay for, we’ve been lulled asleep by the way money launders all the information on what our money pays for to deliver what the economy provides.

(see also What’s Scope 4, and… Why all the tiers?? for examples and full analysis)

______________

It is indeed a little ‘strange’ that a very basic scientific principle of measurement, that every scientist knows quite well already, would be overlooked in defining the world’s units of measure for saving the planet.

Scientific ways to measure things, need to measure the whole thing.  

Sustainability metrics very largely don’t so that, lacking a scientific way to determine the scale of hidden impacts, the method for measuring economic impacts defaulted to the ancient practice of just counting what you have direct information on.    The reality is that the great majority of business impacts actually don’t c come from what is most visible, but from widely distributed uses of the economy that businesses have no records of, paid for by employing all sorts of business services.   The problem is that whether you know about them or not, the risk exposure to serious emerging economic liabilities…  is exactly the same.

Here’s a new graphic to help picture the problem.  It helps to shift from thinking about counting the energy “uses” a business and its suppliers operate with (i.e. traceable for Scope 1,2 or 3, and so on the visible side of the “glass half hidden”), to thinking about the energy uses its revenues are “paying for“, but often don’t have records of (Scope 4, on the hidden side).  It’s the total of energy uses paid for that make a business both financially responsible and directly exposed to the emerging economic risks of physically causing economic liabilities and the harms done.   It’s a serious major overlooked sustainability business risk.    If 80% of the CO2 produced by uses of business revenue actually come from its services, and not its technology,

…it’s all the same to the investor exposed to the risks for the business as a whole.

For risk exposure it’s essential to measure the total impacts on the earth a business is financially responsible for, as that’s where the risk comes from.    Just choosing not to count all the ones your revenue goes to pay for moves the risks to the hidden side of the “glass half-hidden”… but still leaves you just as exposed to the very substantial economic risks of business devaluation many see ahead. Continue reading How full is a “Glass Half Hidden”?

Getting the incentives right requires redefining the units of measure

This is a post for the UN’s Open Working Group on Sustainable Development Goals “Informal meeting on measuring progress” on the new science needed for achieving the SDG’s, “getting the incentives right” as many observers have noted as essential.   In part, it requires “New Units of Measure”   because there is “Something Very Wrong with our way of measuring impacts”

____________

The Need to redefine our Units for Measure and how to begin

Getting the incentives right:

To be effective in getting the results we want, we need to get the incentives right, a matter of understanding both how people make decisions and how the economic system works and would respond.   That involves knowing how to measure what decision makers want to know about.  For investment decisions, for changing how we use the earth one thing they’d want to know is their possible future liabilities for making the wrong decisions. That illusive goal is now much  closer to being solved, with this major improvement in the measure of the impacts of businesses.  The traditional way to measure impacts was to count up what you could trace, and this study showed that what we can trace is most often only a small part, basically because what was being left out was the impacts on the environment caused by the resource demands resulting from the revenue businesses generate as their main purpose, having to date only been counting the impacts of intended operations.   This discusses a comprehensive approach to quantifying them.    JLH

Statement to OWG 6:

Prepared statement For 9:00 AM Major Group Meeting of 12/12/13 on Means of implementation (science and technology, knowledge-sharing and capacity building)  —  “The mismatch between measured impacts and responsibilities”.    Also delivered from the floor at OWG-6.1 the Informal Meeting on Measuring Progress” on Tuesday 12/17/13

Statement: Because sustainability metrics for businesses are just for the impacts of business operating technology, the environmental impacts of the people who operate the business, their employees and those of all the kinds of service providers businesses use to operate, don’t get counted.   Businesses and economists, thinking of money systems not environmental ones, may not see a reason to treat businesses as physical systems and count all their impacts, but you know for sure nature does.   So it’s very common for businesses and consumers to actually be directly responsible for much larger scale environmental impacts than they are told.    Of course the reason we’re measuring impact is for steering a redesign of our economy for the future of the earth, and it would actually be better to get it right.   Using metrics very often in error by 80% or more is really unacceptable as it voids the purpose of measurement in general, but you talk to people and they don’t want to change, sometimes mentioning the inconvenience.    Don’t you think we’d do better to think of the “inconvenience” to the investors who have been trusting us, who we are presently giving false guidance to for what to invest in? Continue reading Getting the incentives right requires redefining the units of measure