
Gamma ray bursts are the most high energy events commonly observed in the universe, associated with the formation of “black holes”, and creating very high energy x-rays. NASA provides good introductory information with a nice animation. Satellite instruments easily record the time and intensity of these events but can only rarely connect them a location. So they’re one of the more mysterious of cosmic events, also common and occurring a few a week.
This journal entry in RNS updates a very sketchy old record of my 1998 study to demonstrate an “Application of the Physics of Happening” using my powerful new analytical method called “derivative reconstruction“, for exposing the active dynamics of phenomena of all kinds, that may be hidden in noisy data. It was published with other new techniques in 1999 as Features of derivative continuity in shape, in IJPRAI.
The 1998 gamma ray burst study was of the data from NASA you see in the figure below, called “BATSE Trigger #551”, using the 6494 points recording gamma rays in Energy Levels 3 & 4, chosen for being less noisy. The object is to reveal the detailed shape of any underlying continuous processes involved, as seen in the second figure. To date, it seems, gamma ray bursts like this are only understood as statistical events, like “bursts of noise”, instead of as dynamic events with continuous processes .
You can see below the clear dynamics of the first of the three major burst events in the record, consisting of a sudden rise without evident developmental processes, followed by an abrupt shift to declining by a regular “S” curve progression, of the decline first speeding up and then slowing down. That connection of two highly differing dynamics is something like the “bursting of a bubble”, with the breach of the containment and the release of the pressure having very differing dynamics. That analogy may not apply to black holes, of course, but understanding two different dynamics is likely important to understanding what is physically occurring.
The other highly noticeable shape exposed is an apparently fairly regular 3 millisecond fluctuation in the cosmic gamma ray background. As to whether is a feature of the data or of the analysis, one can see it is both quite regular and irregular enough. The regularized curves are shown in six colors, each one representing the same derivative regularization applied to a different subset containing concurrent 1/6th’s of the whole data. The vertical lines mark minima for every fluctuation in each of the regularized subsets.
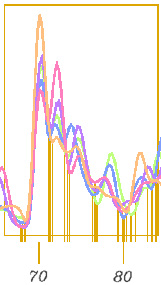
Here is an enlargement of the ~10 millisecond “Micro-Burst” seen from millisecond 70 to 80 with explicitly recognizable continuities of multiple kinds, the evidence of probably being useful for investigating what is happening. In the raw data, if you look, there’s no visible indication of any local event at that time at all, but here it’s show having the same shape in all six of the independent subsets of the raw data!
You can also clearly see that all six subsets display the same fluctuations, varying in scale but having minima at almost the very same times. So we can conclude that the fine scale time and scale alignments, from several independent partitions of the same data, establishes that the shapes are coming from the data.
We naturally then ask: What are those events we seem not to have seen before? There might be new ways to classify the whole family of gamma ray bursts by their dynamic shapes, for example. The visible shifts in dynamics, from abrupt to regularly proportional, probably corresponds to some previously unstudied black hole collapse phenomena. The more or less continual background fluctuation represents an apparently real underlying variation in the number of gamma rays getting to the detectors, from all sources. That it is also superimposed on the bursts themselves seems to raise a totally new set of questions about the space inbetween.
_____________
“Derivative reconstruction” is designed is isolate underlying continuities. It’s done by scanning a data sequence and successively moving points to “regularize” the flowing shapes of change implied by the surrounding points. That effectively stripps away only the local irregularity, the degree to which any point departs from the surrounding shape. So unlike a “running average” it doesn’t change the overall shape or the timing of maxima, but largely just removes the local variation that cancels itself out (smoothing the 3rd derivative in 5 point consecutive point sequences).
What determines the validity is, as always, not exactly the derivation of the method, but whether the shapes exposed are meaningful, for prompting useful new questions about the underlying processes.
The real test is whether the results are useful, and that isn’t always the case, of course.
When it does work, to expose the underlying continuity of flowing processes you never expected, so
you look for provocative results, as if pulling fish out of a river everyone says must be all mud.
There is, of course, a great deal of astrophysics study on the subject. High energy cosmic background radiation research seems thoroughly summarized in a 2011 Fermilab review(1). That overview seems not to discuss the dynamics of gamma ray bursts as individual explosive events, as clearly displayed here.
There’s also no mention of any periodicity of cosmic ray background, clearly seen here as a mostly ~3 millisecond smooth fluctuation, with some places where it’s a ~2 millisecond fluctuation. A 1997 Yale department of Physics paper(2) addresses the specific subject, using fast Fourier transform analysis (FFT) to look for periodicity in all the BATSE gamma ray burst records, reaching the conclusion that no significant regular fluctuation was present, saying:
Unfortunately, no significant periodicity was uncovered in our search. We searched over a wide range of energies and over various time intervals for 20 of the brightest BATSE bursts for frequencies from 30 to 62500 Hz. Since BATSE is likely to provide the largest collecting area for a substantial length of time, and our bursts were among the brightest, our search is likely to be the best search for millisecond pulsations in GRBs for the foreseeable future.
Our lack of pulsations can be explained by any of several possibilities. 1) First, GRBs might not contain rapidly rotating, highly magnetized neutron stars. 2) Second, an expanding fireball cannot significantly rotate to exhibit periodicities. 3) Third, even a confined burst on a highly magnetized rotating neutron star will show no pulsations if the emission is isotropic. 4) Fourth, the pulsation period might change rapidly compared to the duration of the burst. We cannot distinguish among these explanations. [#’s added by JLH)
I might offer a 5th possible reason. Perhaps not having a way to sift out the signal from the noise, for isolating the underlying continuities in the data, would allow the data to be interpreted as lacking continuities and,
5) the local noise in the raw data might affect the statistical results of FFT,
__________
I really would like to have others check my results, particularly as far as the theory behind it goes at first. The general question is whether this new method of analysis tells us something new and useful or not. That may be much easier to test than by duplicating my results.
Duplicating my results would take considerable software development work, unfortunately. The package of LISP routines developed for doing the curve analysis and drawing plots were done using a graphical database too expensive and complex for others to learn, that no longer supports the earlier version lisp routines… So I basically I basically lost all my programming work on it.
The underlying theory, though, rests on mathematical methods for applying a new extension of the conservation laws as a “general law of continuity”. It originally came from my following a hunch, and deducing that the conservation laws implied an infinite series of conservation laws, implying strict continuity in all derivative rates of change…! The original 1995 theorem (see p8-12) establishes the very useful general physics principle, that:
all changing rates of energy use begin and end with continuity
As a limits theorem it says that systems for using energy need to develop and subside by accumulative changes, originating in unobservable beginnings with successive phases of development, without change displaying infinite or absent accelerations. So change using energy is restricted to some form of “S” curve, a non-linear process of speeding up followed by non-linear process of slowing down.
Of course, that is exactly what we consistently find for energy using processes of all kinds.
The general exception is when we lack the information to observe enough detail of the continuous processes implicitly underlying the information we do have, and so can represent the subjects statistically. What “derivative reconstruction” is designed to do, then, is to reinforce flowing shapes in time-series data, so the eye can look for the recognizable shapes required for the continuity of natural change.
I think it’ll prove very useful. I’d love it if someone else would check my math.
JLH