Paul Maidowski @_ppmv offered to respond to some of the tough questions about Climate change. On Jan 16 I posted the following image of how climate change has only accelerated parallel to economic growth, with no recent bumps or bends in the curve, starting the short discussion below (w/ minor edits for clarity).
Paul, Why don’t climate scientists take into account the main accelerator of climate change, investors using the economy’s profits to continually multiply the scale of business? Don’t they see the trap? https://synapse9.com/_r3ref/100CrisesTable.pdf…
Paul’s response
Hi JL, amazing document, thanks! I believe the training of climate scientists keeps them from speaking with authority on other fields – or even engaging non-mainstream analyses. they’ve been burned with the hack in 2009 before COP15 at U of East Anglia, and never recovered. Structurally I link this to whatever causes allowed Nordhaus and the economists to sideline Forrester and system dynamics in the 1970s / 80s.
They may see it as individuals, but in their functions, as scientists or in their institutions, they feel they cannot speak to these questions. I think this is changing now, slowly. But of course, it’s very late. What do you think? It greatly puzzles me too.
Jessie’s response
Paul, Good points. I think another major factor is the backroom control of public interest organizations by financial advisors. I’ve seen that at the UNEP and the WRI, two premier research centers, much adding to hesitation to explore outside the rails. There are systemic sources too, like data representing reality to formal research, and money exchange erasing all negative information, the reality of the growing impacts seems to vanish. So, nearly all decision-making is blinded to the growing threats.
Along with every field operating within its own boundaries and the systems sciences failing to make physics methods work (omitting the myriad autonomous systems) about the only honest voices are of protestors who don’t quite see that the problem is really that the financial system is flying blind, IMHO. FYI
My own approach has been to focus on how most people become experts in starting, resourcing, and perfecting their complex home and work designs. Those are like making dinners, doing office projects, and developing lasting relationships, all of which also follow nature’s plan for making new things that last.
So, if we study how people make systems that work well and it is written about, it could give professionals and protesters both a good idea of what we need to do. The critical point in every complex system design is reading the signals to turn from starting to finishing when perfecting the work becomes the key to making its value last. The recent paper on it is: https://synapse9.com/ISSS-21/ISSSJul11NewSci-IndividSys-MS.pdf
From a natural systems science view, every culture change is a growth process.
As with all growth processes, the start is small exploratory steps that if successful settle on some main direction, or directions of new development.
That development then either switches to refining its internal design and maturing its environmental fit, to establish a lasting way of working in its new world, or it starts breaking up for not establishing a home.
In a world like ours, changing ever more rapidly, as a rule, our cultures like our economies driven to redesign and reorganize ever more rapidly, we now see them also tend to split up and follow divergent paths, too, unable to predict or control their own growth as the old ways holding them together are torn apart. In the past we called it creative destruction. Now it’s become destructive creation and multiplying technology and investment disrupt social contracts and our ways of working multiple times in a work-life and driving growing angry discontent in every direction.
The problem isn’t growth per se, but not even intending to finish it, not heading for the steps needed to make the culture change of the modern world something of lasting value, to both our many societies and its environment.
My friend Linda, among many others, said “the problem is we leave out Nature, the true ruler of our destiny. This is the big correction taking place. But because we have left out Nature, we do not understand it. No system can override Nature.”
I told her “Yes, and though everyone is feeling the strain, not understanding how we left out nature we also don’t see what to do.”
What I’ve come to is one possible way to close the gap. There’s a key level of all our cultures that displays how everyone does indeed nature’s method of building lasting complex systems. It is in our familiar methods of doing work projects at home or the office. We start and finish them to give them lasting value. We don’t leave our work half-finished to get ourselves fired or divorced.
The normal way is to start efforts with some small intent and look for how to build on it, then discover that it needs to fit a range of intentions and fit with the world around it, making adjustments and adding details to finish it off for delivering a lasting service to family or clients.
In other words, it’s not starting but finishing things that give them lasting value, placing the key in the arch that lets it stand up, furnishing a home that makes it liveable, coming to an agreement that is the purpose of negotiation.
However, … the internet is designed to endlessly multiply information and exponentially change how we live ever faster, like the economy too, making ever-bigger changes in how we live, sure to keep becoming ever-more unmanageable and to derail sometime, making nothing to last.
Who’d think the host of “experts” the world relies on would all make the same fatal blunder that everyone at home or work knows how to solve??
We need to pass it on I think. There must be a way that the people who care to make things work in their own lives can have a say in our common lives. Every system begins with growth and our ancient cultures seem to have all learned from nature about how to make things that last, making nature part of our design!
_________________ “Natural growth” is nature’s way of creating long-lasting new lives, of all kinds.
Intro: How system responsiveness is expressed in natural growth is as anticipation of the opportunity to end growth by perfecting the emerging system. To do that, the system’s steering needs to switch from multiplying to harmonizing (i.e. maturing) its design and place in the world.
The figure below is something of a list of what to look for in any particular case. All systems emerge with compound growth and then variably navigate their futures. A talk on the core natural science for an ISSS forum on Oct 2, 2021, is on YouTube!; the research paper (1) below.
__________________
Throughout nature, living systems of all kinds develop by a growth process with three main stages. The first stage is an explosion of innovations in extracting and capturing resources from the new life’s environment, furiously building the new entity with what’s available. Varied examples include a seed sprouting, humans sprouting in the womb, the compound growth period of businesses, economies, and cultures. It also includes the take-off periods of new relationships and all other emerging organizational systems with lives of their own. The second stage follows the first, exploratory and adaptive maturation of a new life as it finds its place and purpose in life, creating its first niche in the world by a slowing process that perfects the emerging design, to be released to forage the greater world starting its longer third stage of life, building wider environmental relationships to last a lifetime.
Genuine “thriving through transition”* can be achieved throughout, from extractive innovation to adaptive maturation, and then finding and holding a niche in the future, even lasting into graceful decline. This storyline for how new lives develop is also found at every scale of macroscopic life of every kind, making it quite a wonder that it seems not yet studied in the sciences, nor part of our general cultural understanding … It’s so much a part of all our experiences our blindness to it is almost as if we’ve been looking the other away, not seeing how living systems work by themselves distracted by looking for something else. Perhaps we are always looking at nature only for how we can control things rather than for how nature works by itself.
A scientific research paper on the subject (1) was presented at the July 2021 meeting of the ISSS. What contributed to its success was focusing on how people already know a great deal about nurturing and guiding new lives of many kinds, initiating and supporting their growth and maturation up to their release. But, unfortunately, we do not talk about it much because it’s quite complex and is naturally intuitive for familiar creative work we mostly do non-verbally. So our discussion of it has lagged far behind. Just think about the difference between the start-up and finish-up stages of any kind of work, and how the work switches from multiplying the early patterns and then harmonizing them to achieve a truly lasting result.
For example, we follow much the same natural creative growth stages in making dinner. We start making dinner by first exploring what might be put together, at first taking small steps, then building up to large steps, and then back down to small steps again to climax with finishing touches as we sit down to eat. Raising a child or starting a business are far more complicated but follow the same creative, exploratory starting than perfecting stages to finish. Growth also faces numerous challenges along the way. If fortunate and skillful overcoming the challenges can be a thriving process all the way, taking a living system through its immature then maturing stages to serve its mature life.
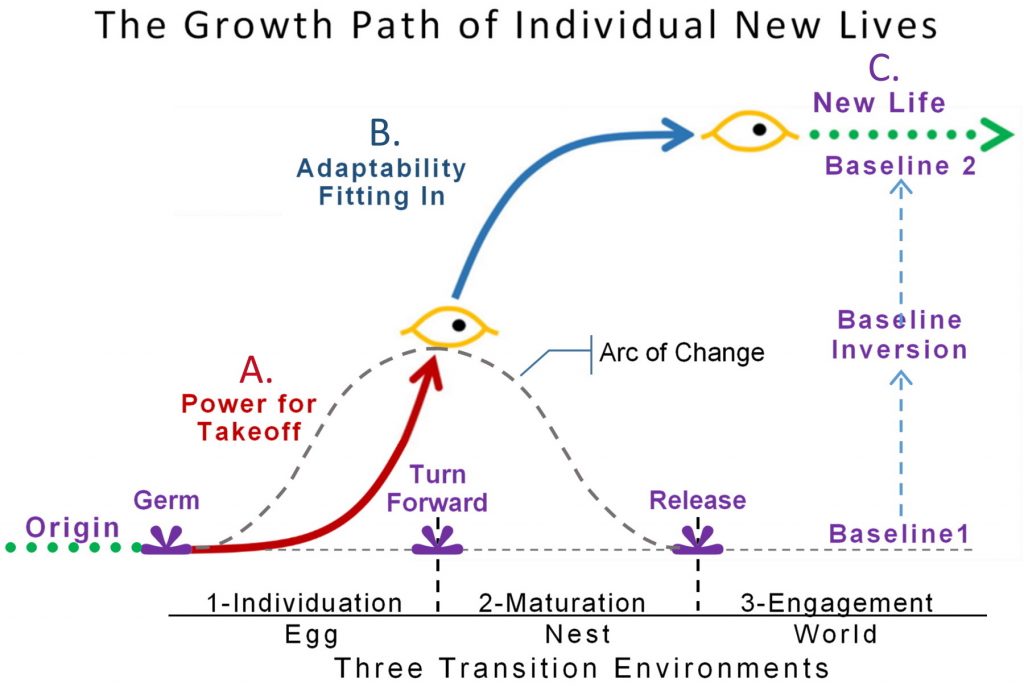
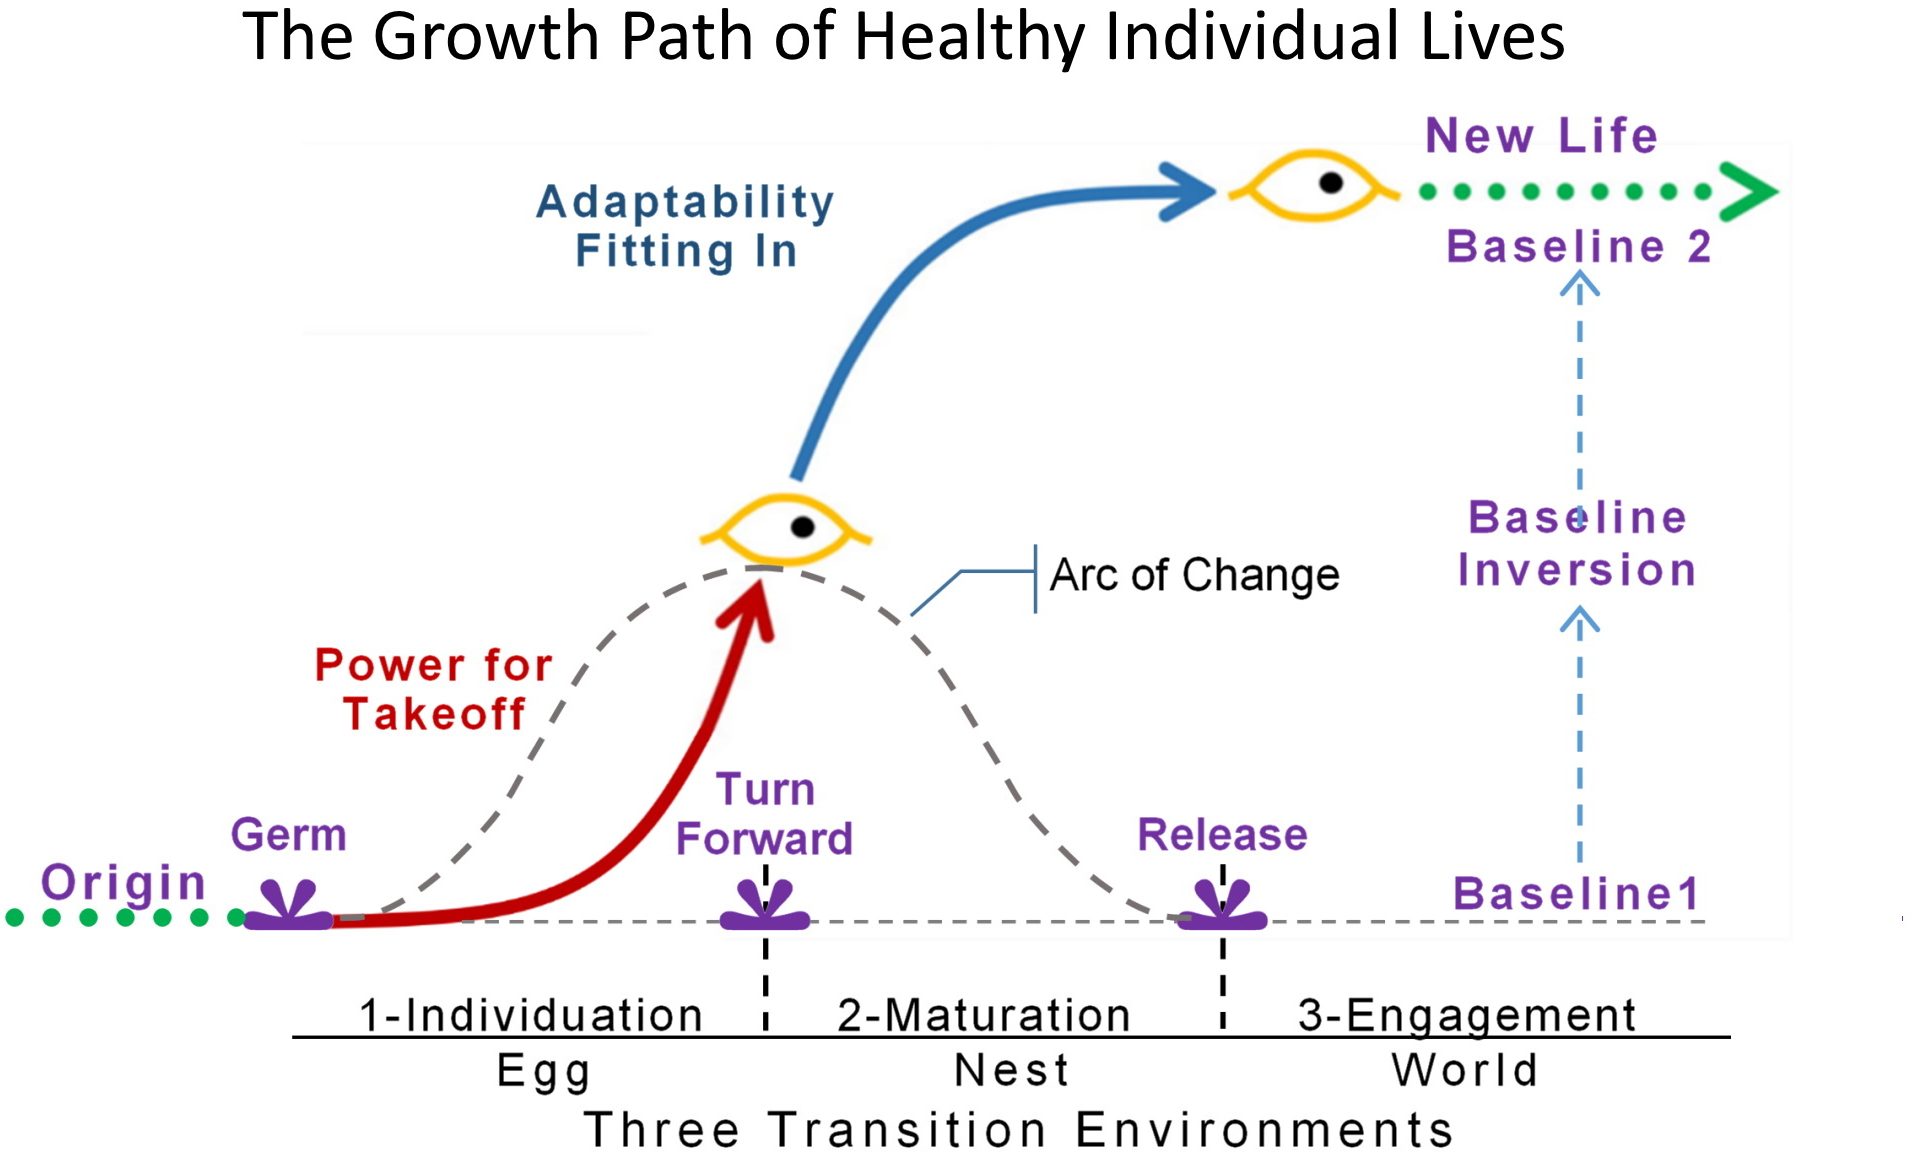
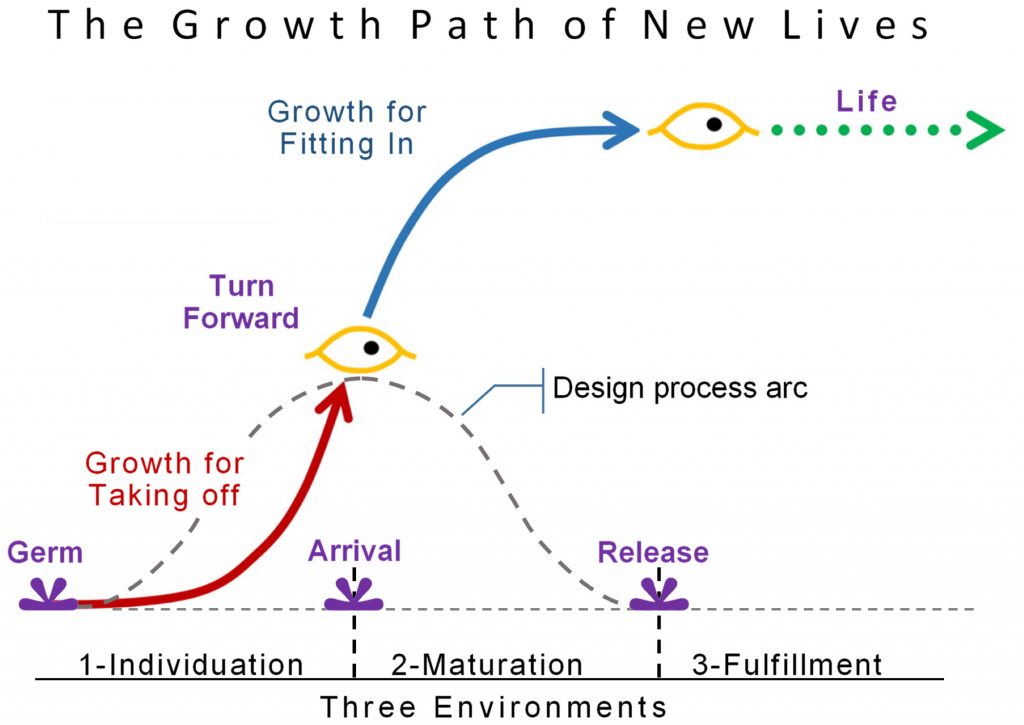
The figure below is from the research paper, the composite diagram of the general growth stages of new lives, illustrating the A, B, Cs of new lives. Individual new lives will diverge from the simplest common thread of development for all new lives. Instead, each will build its own life, displaying considerable variation on the paths taken as it builds its own chain of developments, confronting its individual challenges along the way. Every new life will first build up from small to larger steps, though, and then build down from large to small steps again to finish. So the two sweeping curves are just for typifying the normal course of the progression, also called an ‘S’ curve. So the shape might as well be shown as an uneven staircase of minor and major challenges if that were not hard to draw and too specific to represent the general pattern.
The best way of reading the figure might then be to imagine what thriving would be like for particular new lives making their way through the long series of challenges of ascending levels. Then to cement the generality of the pattern in your mind, think through the periods of struggle, thriving, approaching, and receding challenges for the largest scale, the new life of humanity we are building now! So far, its first stage of growth for modern civilization has been around 300 years long and is now facing an existential crisis for not knowing how to transition to maturity. That challenge is one of the things learning to verbalize the steps of growth can help with.
The most important growth challenge of any new life is the big one in the middle. That is the great challenge world society and the economy are having the most difficulty with. Having designed our world around making the first stage of growth endless is both the big barrier and the main cause of all of our multiplying world crises growing with growth (2), pushing growth too far and too accelerate too fast to coherently adapt to the most conclusive sign that growth is at its natural limits.
The natural path of escape is labeled “Turn Forward.” It’s the shift from focusing available resources on multiplying the initial concept to using them for perfecting our designs and finding ways to thrive in our new environment. That shift from thinking about the past to the future is what turns a new life away from multiplying its past to finding its future, discovering its greater purposes and roles in the wider environment. That is a very good kind of work, one that the whole world is abuzz with today, even though our institutional systems are totally unprepared for and dead set against. That’s why we most need to learn how to discuss the problem. Our institutional world is more built on talk than intuition.
The natural pace of change can also shift faster than it seems possible. Look at the figure and see how the “Turn Forward” corresponds to a “Baseline Inversion.” That is a whole-system shift in the direction of its change that can occur with almost no actual system change, an “inflection point.” Before that point, expansion of the system was in proportional steps of divergence from Baseline1. After the inflection point, expansion of the system develops by proportional steps of convergence toward Baseline2, to arrive at the end of physical growth at its new home where the new life becomes freed to be itself.
_________________________
Please do add comments to this article or email questions and comments to me at sy–at-synapse9-dot–com.
*Note: The phrase “thriving through transition” is from Trae Ashlie-Garen, expanded on here to apply to the full set of any of life’s transitions.
To make our escape there’s not just one requirement, but the main path is to join the emerging understanding that our new age of growing environmental chaos is a natural result of overextended compound economic growth. In nature, growth is a tricky two-edged sword, the greatest of gifts to begin with then the greatest of threats if not converted to things more lasting (1).
Living systems invariably begin with a period of multiplying the parts that capture more resources than they use. Starting things with an explosion of new life is part of nature’s beautiful complex process, so we should be glad for it, but only to a point. The catch is that for our world to survive its period of rapid growth we need its growth to climax in time. Otherwise, growth will generate huge surpluses of false profits as it undermines its own foundations and spreads chaos throughout its environment.
We see that in every corner of the world today, enormous creativity going into generating false surpluses disrupting the environments the economy is supposed to serve, but now attacks instead, spreading chaos rather than healing. For example, COVID seems to be causing chaos around the world, a natural virus not immediately our fault. However the chaos is enabled by our extreme overpopulation, our strings of inadequate responses, growing mistrust, and belief in conspiracy theories, led by magical thinking that the earth can be profitably exploited to infinity, Our world consensus plan is actually TO MAXIMIZE OUR RATE OF GROWING EXPLOITATION OF THE EARTH AND HUMANITY FOREVER, as if we didn’t see what that does. All those compounding factors generate more virus variants and more chaos. Lookout. Here it comes.
So what we need to do is “get the big picture” and start using our collective profits for better purposes than terrorizing our home planet. The best way forward is to use your own life as leverage for guiding your world. There are lots of good things to do and lots of better business models too, though almost no one seems to understand the right way to address their global impacts.
OUR TRUE SHARE OF RESPONSIBILITY FOR THE ENVIRONMENTAL CHAOS WE ARE CAUSING COLLECTIVELY IS EQUAL TO OUR SHARE OF THE ECONOMY. In a global economy, one’s share of the economy’s impacts is also what we pay for. For example, a business pays for every impact of its entire supply chain. That is by requesting, paying for it and profiting from it. Yes, it is a shared responsibility with its supply chain, of course, not exclusive, and a business has no direct control over much of what its supply chain does too. However, the impacts would not occur if they were not paid for too. So the UNIVERSAL RULE OF THUMB IS TO TAKE RESPONSIBILITY, IN PROPORTION TO YOUR SHARE OF THE PROBLEMS THE WHOLE ECONOMY CAUSES, BY USING YOUR LIFE AS LEVERAGE TO CARE FOR AND STEER OUR WORLD TO SAFETY.
I made a very well-received talk on the subject, called “Understanding Nature’s Purpose in Starting all New Lives with Compound Growth.” That was on 11 July 21 to the International Society of Systems Sciences (ISSS) meeting, in the Special Track on “Future Society”. It was a wonderful group of a dozen presentations, all focusing on the heart of our global problem. As systems science, each is a bit difficult, but the consensus was that each one was also converging on much the same great truth, that like all great truths, could potentially set us free. I’m not sure when the others will be posted, but my talk is on YouTube and it and the paper are linked from my one-page Abstract for the paper.
Let’s clean up our act and get going. We have lots to do. It’s not a straight path but once you get your sense of direction it will be extremely satisfying.
After inception originates a desire, a long struggle for change follows and then a fast breakout and establishment
– To understand these best, think of examples in different circumstances from your experience, personal, business, world, or in nature.
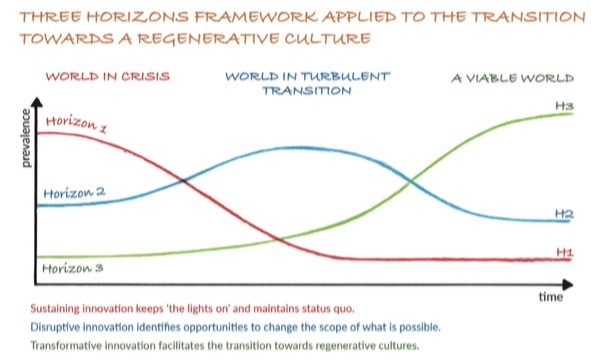
For the transformation to an Ecological-Civilization there’s the barrier of needing to introduce people to something very new. If we study examples of how transformations happen in our memory we can find ways to convince people to explore what’s possible.
the universal stages of growth and adaptation that create new systems with lives of their own, small, medium, large, in a permissive environment.
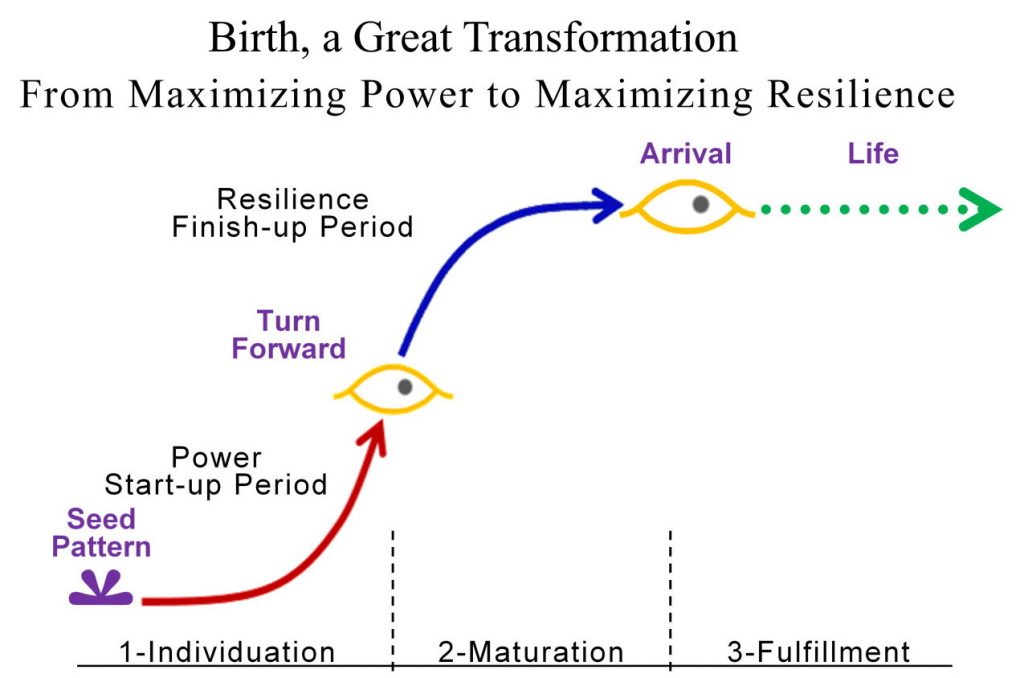
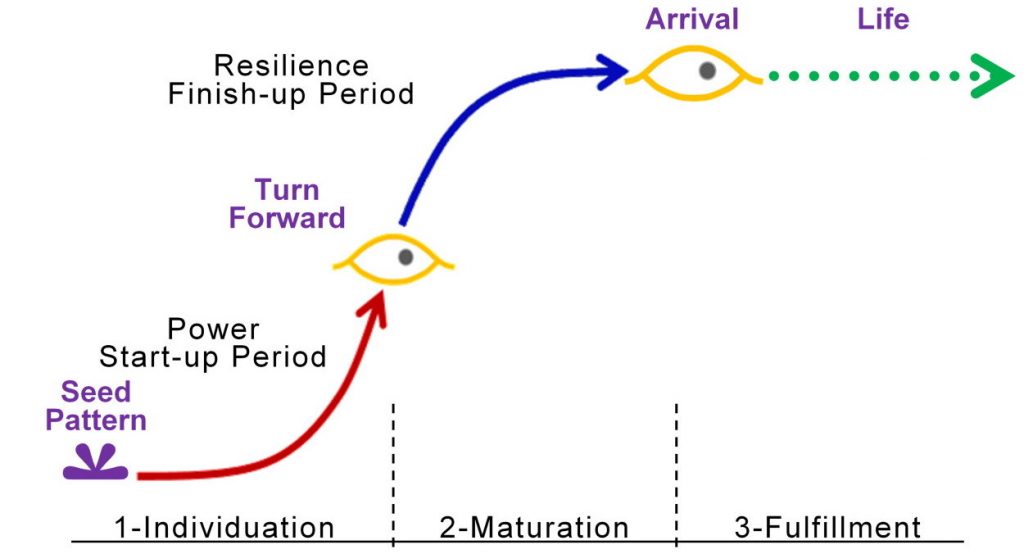
Studied carefully, it’s possible to use nature’s own method of building new systems to guide our long-term path, showing us how to move forward from growth. Stage One of new lives is the germination of a seed pattern followed by a start-up burst of development when the new life defines itself as an individual. For enterprises it’s the handshake that sets things in motion and its period of rapid growth. Stage Two is for a new life to find its lasting place, maturing as it adapts to both internal and external limitst, Arriving at it peak of vitality ready for Stage Three, its long creative life. The curves tracing this story line are highly generalized, as are the terms used, but any startup faces these challenges.
Once you get the idea it’s astounding how many kinds of familiar transformations, on all scales, follow this natural system-building process for new lives. For projects large and small we execute our plans first starting with a concept, then working it till it is ready for its climax environment, — individuation followed by maturation and fulfillment
The start of new life is a “germ,” “spark,” or “seed” pattern, a vision or a fertilized egg, that soon starts to multiply on its internal resource and organize its internal parts, usually in a very protected and forgiving environment. For a human embryo that’s its womb, for an Eco-civilization it’s the virgin earth, giving us whatever we wanted for a long long time.
Then along with a dramatic change of environment at the limit to growth, there’s a change of life — a “turn forward” to maturing to make new relationships. Like birth, the end of compound growth is a perilous change requiring a great change in relations, resources, and expectations, a big test of survival a system’s will-to-live. It’s called the “turn forward” because attention turns from extrapolating from the seed to making a mature life in the future, in a more challenging environment.
For our newborn Eco-Civilization, hitting the limits to growth comes as a complete surprise, and will take the emergence of a great will-to-live, and lots of work to pass nature’s universal test of survival for new lives. Most of the human population is still blind to the profound change at hand and thinks growth is life, and that overcoming our troubles will be like returning to the past. It won’t BE THAT AT ALL! We’re heading for mature life, which given nature’s ways could be far better.
As humans, we have distinct advantages for charting our course. We have loads of experience in giving birth to all kinds of systems and giving them lives of their own. Personal relationships are one, requiring that we follow each step in the process and making good choices about going too slow or too fast, among other things. Making dinner is another, needing to be lovingly imagined, assembled, and perfected to serve its purpose. Both home and office projects fit the model too, starting with a seed that grows and is made to fit into the world around it.
So the fact that large systems go through much the same birthing process as small systems is a new discovery. To manage the end of growth for our Eco-civilization will call for all our personal wisdom for what’s right to help us understand what’s too slow and too fast, among other things, for the transition to an Eco-Civilization.
It will also have to do with money, so tied up in driving what seems like a growth imperative for civilization to operate, but is really just a choice of what to invest in. And now we need to invest in better things, like #FAIR_Money.
Allows different people to think of working on different paths, which all work out together naturally. Small steps needed for bigger ones, big strategies that make room smaller ones, things to wind down, things to build up, temporary measures for both.
Based on forest of cultural succession. A very loose model, much of it misleading for transforming our growth system. Might be applicable to the progress of humanity through its long series of failed civilizations, making cultural progress all along. Might be applicable to the ebb and flow of the ‘forests’ of political and intellectual fashion as some of us stumble around trying to imagine the future and others find ever more dastardly ways to say NO.
A wonderfully intuitive model, starting with local innovation in designing for internal human needs and external responsibilities builds familiarity with the natural system model of cells in the environment, envisioned to extend to our whole world to take better care of ourselves and the planet. Join the movement.
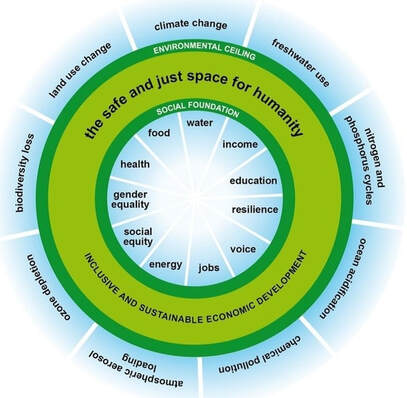
The only way to address our global limits is with global coordination, and for many things global coordination is absent. The nine planetary bounds referred to in Doughnut Economics are certainly critical, but there are a great many others going unmentioned, equally critical. These include:
escalating disaster risks due to overdevelopment and climate change
the growing long-term economic damage to capital resources,
government problem-solving failures
growing governmental lust for power
aging & inflexibility of ever more interdependent and complex systems
growing social polarization, ….. and other great systemic world crises.
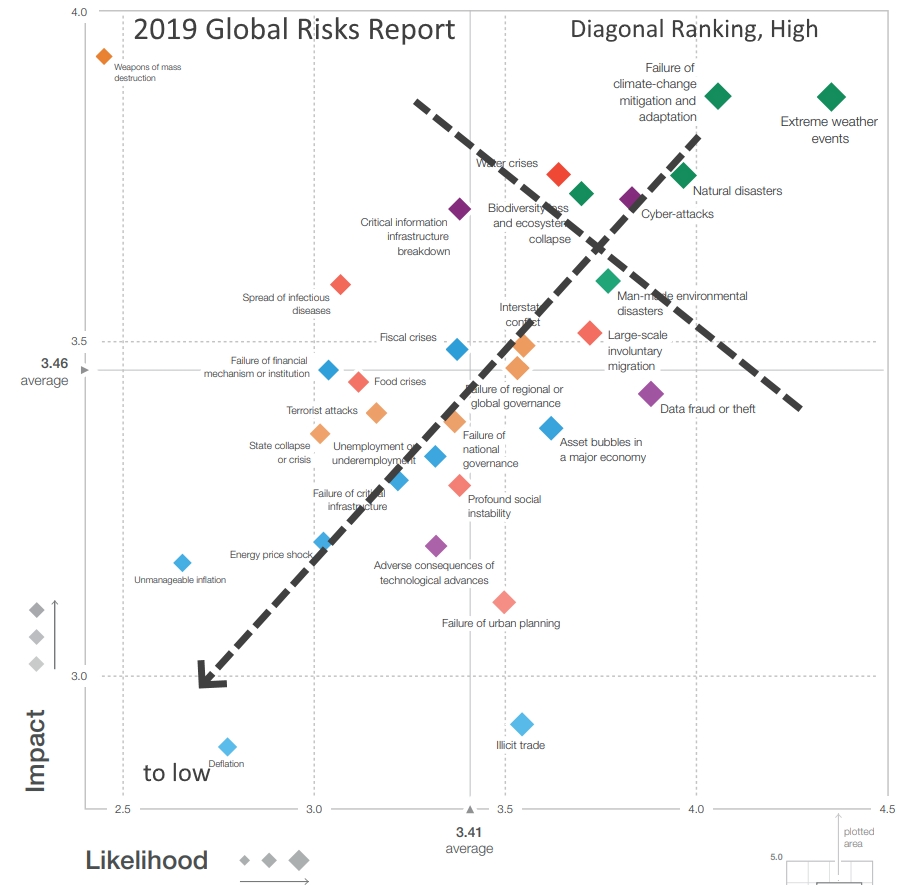
Here’s my long list of planetary boundaries we are rapidly crossing, my Top 100+ Global Crises Growing with Growth. It is based on collecting lists from high-level reports, the major crises getting brief notice in the news, and my own description of flashpoints of unsustainable systemic change. Here’s a link to the 2021 Global Risks Report.
It is my belief that these kinds of growing systemic threats can only be reversed by a movement of global business and investors choosing to shift resources from pushing the harmful limits of wealth to fitting in with a healthy world society and environment.
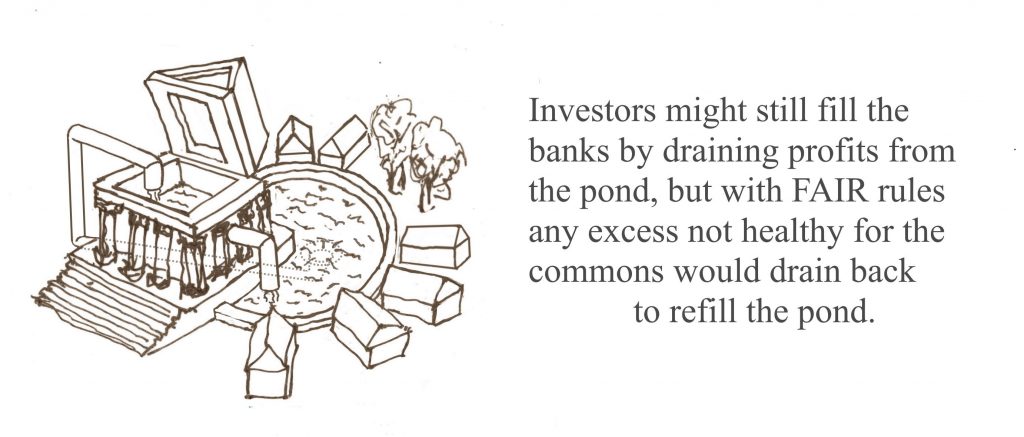
The FAIR rules act as an overflow valve, to redirect excess savings of passive financial income (normally used by investors to extract exponentially more) back to the free circulation marketplace of the pond to keep from draining the pond and guide investor self-restraint in extracting profits from the earth.
FAIR_Money sets a UBD, Universal Basic Distribution, a standard % rate at which investors need to distribute their excessive savings from passive income.
Fig 1. Finance adds funds to free circulation commons, but with strings attached for taking out more as ever-growing profits and escalating drain on the common pool, causing punishing inequality when the economy faces natural limits. To restore balance the FAIR rules ask investors to distribute accumulated profits to qualifying non-profits serving long-term societal needs. That would sustain the profitability of an economy seeking balance with the planet and our need for a good home. .
Title Principles of Fiduciary Asset Investment Restraint (FAIR), simple rules to restrain the compounding of unearned income to reverse the present worldwide continued overproduction of demands on nature and society, our great tragedy of the commons. Ownership comes with natural responsibilities.
Topic Compound investment (adding profits to investments) is required to get any enterprise going, but as seen throughout nature is only what starts things, not what makes them sustainabnle. If overextended what it does is globally multiplies the power of the owners of the world over all others, creating the great array of world crises of neglect disrupting global society and nature we see today.
Asking investors to take responsibility for bringing growth to a climax peacefully, tempering their greed for the common good, appears quite necessary for long term peace and prosperity, even if it still seems quite impossible socially. It seems to conflict with the absolute rights of blind ownership. Now lots of owners are beginning to see the grand catastrophy their habits are causing, and that society’s rules should reflect how people would like to live without looming threats in every direction.
Pitch Flatten the curve of growing environmental and cultural exploitation, to reach a thriving peaceful economic climax.
Image
50050
Fig 2 The universal pattern of emerging systems that sustain their climax
Statement The world financial system has but one value, to use the earth and human societies to maximize the growth rate and concentration of financial wealth. That leaves out concern for the resulting matching degradation and disruption of natural capitals and human society. To secure the wealth of nature and humanity we must then have Fiduciary Asset Investment Restraint to prevent the rapid decline of whole system value, and secure a good home for ourselves.
In all fairness, FAIR is just one appealing, comprehensive, and eminently fair way to rebalance the compounding of profits consistent with the long term interests of the earth and humanity. There are also tax and negative interest rate means of “topping off” excess passive savings to restore global balance. The value of FAIR is its focus on everyone’s shared duty to serve common interests. It would of course be backed up by legal penalties and alternate means of distributing excess financial savings, once people see the real need to change our way of living. Of course, all three means could be combined, perhaps led by FAIR distributions by individuals accepting their natural fiduciary duty to care for the earth.
FAIR rules would also only gradually reduce the financial imbalance caused by compound investing, and adjusted to not stifle individual financial creativity as it limits punishing demands on nature and society. Spending a fixed annual share of accumulated profits from investments in times of severe imbalance like today, torturing nature and tormenting wide sectors of humanity, would give investors global guidance on how to value the gifts of nature and human society. One must also caution against the use of FAIR distributions for just reliving symptoms of the systemic overaccumulation of savings, as simple symptom relief would fail to steer people’s lives onto sustainable paths. For example, food and services should be offered, but take a back seat to strong socially led education and self-organization efforts.
This is actually a strategy first discussed by JM Keynes in Chapter 16 iii & iv of his General Theory. I’ve interpreted it as an “overflow valve” for excess financial savings to relieve unhealthy burdens on the earth system, dialing back unsustainable extractive investment and relieving the whole economy’s pressure on all our cultural and planetary bounds.
The degree of relief from excess demands on the system would be adjusted with on experience, starting at 10% a year of accumulated for argument sake. That rate would most often not increase wealth distribution to undermine the individual life styles, just skimm off the top. The rate would be adjusted to gradually stabilize the economy’s impacts on earth and society at a comfortable level, both for long term profit and to treat a living world with respect.
In the end, finance would stabilize to generate steady flow of profits for personal and priority needs, the economy thriving as a continually innovating cash-cow business enterprise. In Hardin’s Tragedy of the Commons, the equivalent would be for the rich farmer to see the error of killing the commons, and devote his excess cattle to relieve community suffering, hosting periodic feasts to save the commons and bring the community together, seeing their right to become a welcome hero for giving up the role as the devil himself.
Need Even ignoring the COVID pandemic, the world faces a considerable growing plague of plagues from centuries of growth putting excessive demands on societies and the environment. A sobering list of The Top 100 World Crises Growing with Growth illustrates the problem. While mainstream finance is starting to recognize the need to not just maximize profits at any cost, so far that has largely been only to factoring the risks to ever-growing profits, not harm to our future. Since maximizing the compounding of profits seems to be the real problem, a new way to do it doesn’t really solve the core problem. It also ignores the very numerous other global crises threatening our future, exposing the grand “tragedy of the commons” of global overinvestment for which we are responsible.
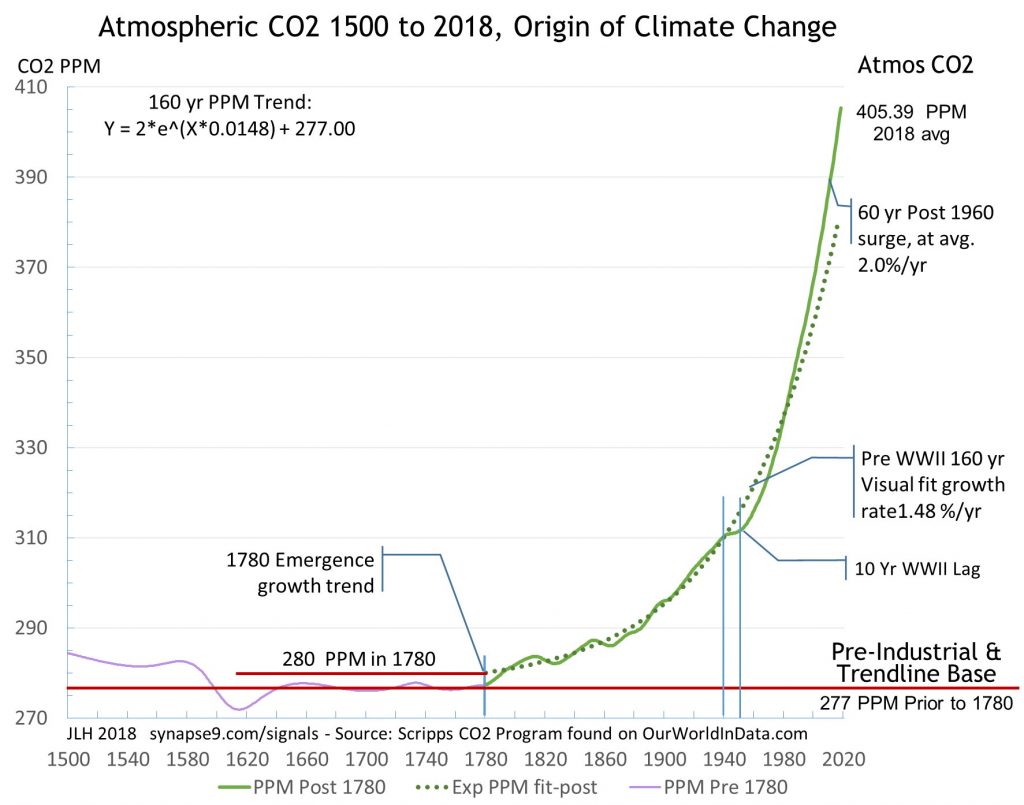
Is that partly a matter of the kind of investment we built civilization with? Of course. A tree can’t change its own trunk, roots, and branches though, only slow the new branches to halt destabilizing overgrowth, if it’s not too late. So we should expect a natural Fiduciary Duty for investors and businesses to develop, to the best of their ability, and guided by the progress of the global crisis. That is a way for responsible investing to become universal without expecting investors and businesses making their decisions to understand all the up and downstream impacts on others or the system’s pressures on its whole range of planetary boundaries. In a way, both forgiving and frustrating, the research on global measures of our economic impacts (Henshaw 2011 Systems Energy Assessment) strongly suggests that causation for whole system impacts is so widely distributed it’s generally necessary to consider them as equally distributed per share of the economy, like today’s nominal average CO2 Emissions of 0.26 kg (0.6 lb) attributed to every $ of GDP PPP. Understanding the CO2 has both historically and currently increased in lockstep with the world economy shows the real problem that forces us to remove the growth imperitive as part of responding to climate change.
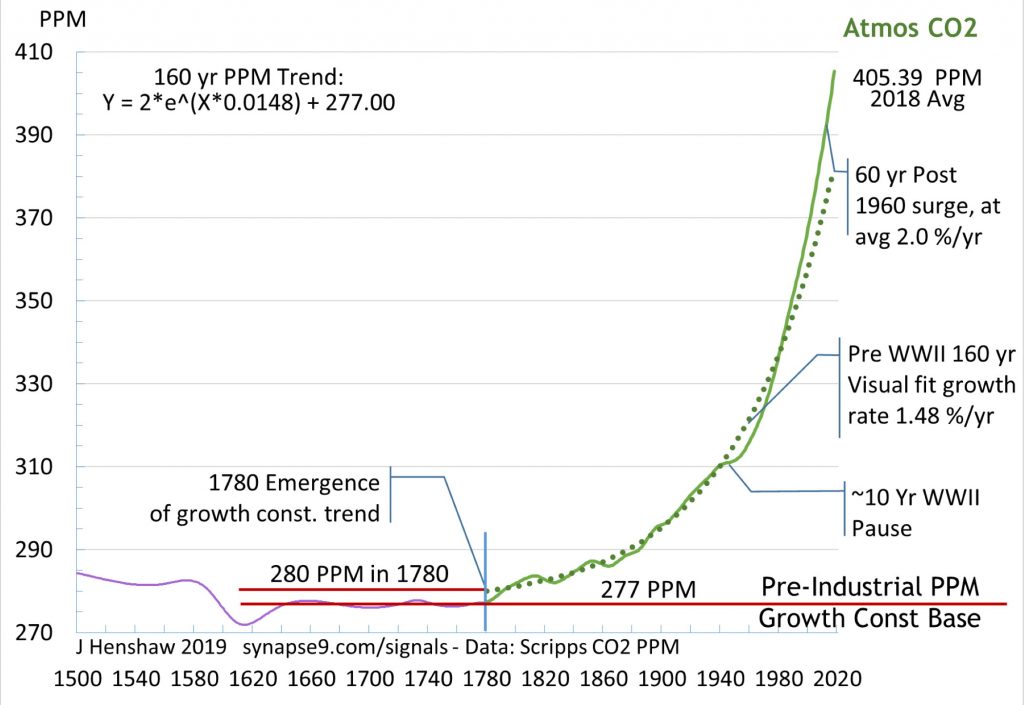
Fig 3 the history of Atmospheric CO2, with fixed growth rates from 1780 to 1940 and 1960 to the present
The main determinant of success for FAIR distribution of excess savings is not just the relief of pressure on the global commons it would bring. What matters as much is whether the money is well spent, and delivers “good works” of long term value. The expectation is that people with accumulated profits to distribute, with some technical guidance, would have an “eye for value” and see what the world needs to be successful, having demonstrated a comparable “eye for value” to make themselves successful.
Spending to serve the common interest presents the same kind of creative investment problem only looked at in a new way. FAIR spending is an investment decision for serving the system as a whole, that will be returned with profits of other kinds you couldn’t buy. That is the same way a family benefits from spending savings on educating its children. That is saved profits well spent. It’s a question of “feeding” the world something nourishing, not “controlling” it.
Well spent, FAIR distributions would teach both people and institutions about the patterns of growth in nature, and how investment at the limits is returned manyfold.
Because the FAIR spending of assets is something of a new investment field, it would need guidance and support from economic research and modeling. Also needed is a connection with the social networking of practice communities, both to guide to creating lasting value. Initially, it would be a voluntary adherence to a community principle, and then later formalized to be more widely applied. With new proposals for expansive strategies, the devil is generally in the details so serious economic modeling and rulemaking study to explore options. The scientific study of how finance is coupling with its growing planetary impacts, reliable sponsorship, and teamwork in building the global movement are all critical.
The hope is that the principles are practical and clear enough that they could spread naturally and become socially expected. Even connecting idea that growth is responsible for our problems continually racing out ahead of our solutions should be a task for a global IPCC-like scientific network, perhaps called the IFIC (International Fiduciary Investment Council). That would focus work on systemic research, to guide national organizations on rating impact investments for the commons. Someone will need to attempt to “qualify” the likely impacts of different kinds of for-profit and non-profit grants and investments. Coupled with each investor’s eye for value that could be relied on to steer the economy through its many present crises, including COVID, to a thriving and lasting climax.
Challenge: This proposed “human duty” (to go along with our “human rights”) for investors and business to devote a share of their financial savings to serve the common interest seems simple enough to define and discuss in principle. What’s harder to define is how much time we have to avoid the next wave of crises, as in the past, likely to be as unimaginable to us now as the present ones were before. We should “Build Back Better,” and with an eye to economic, planetary, and environmental justice.
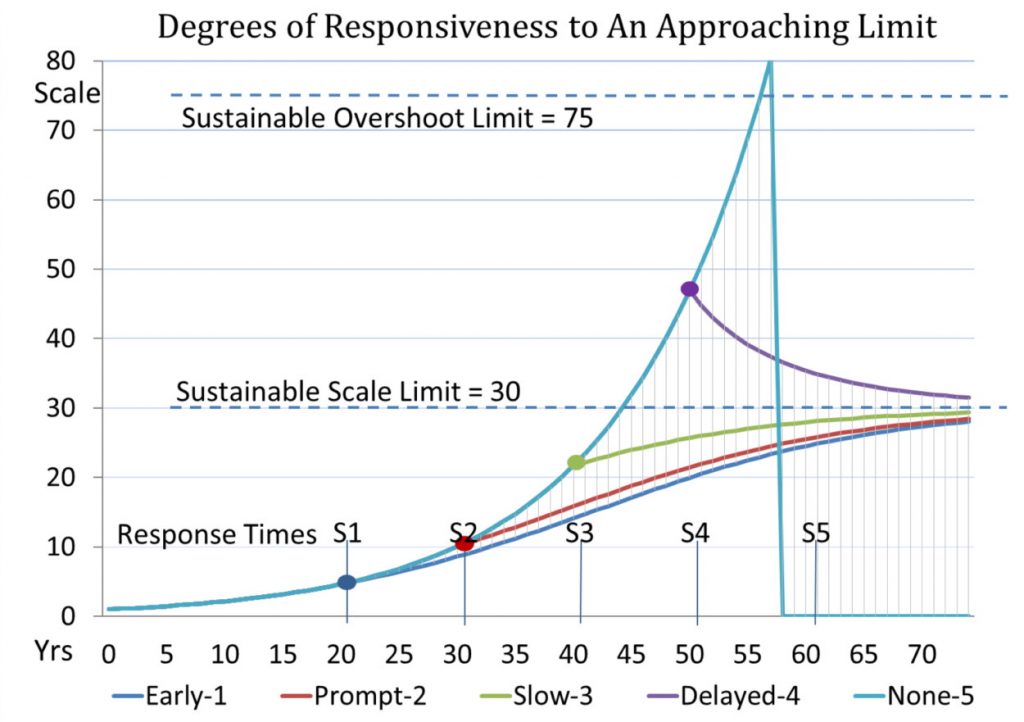
Restoring the economy to maximize its long term growth is the most dangerous course of all, inviting a crippling systemic delayed response like the delayed responses to COVID-19 which caused most of the deaths. If we just restart the growth economy, already severely weakened, you might expect the kind of failure at the limit shown by the light blue upper curve (Fig 4). That choice amounts to no response in the end and leads to system failure. We seem already well beyond the sustainable limit and so only have a last-chance response, to turn toward the sustainable limit like following the purple curve.
Once the world realizes that businesses and investors do really have a natural duty to steer the world economy in the common interest we’ll find more ways to do it. The physics of responding to natural limits (Fig 4) shows that early responses to natural growth limits don’t significantly delay the approach to the limit. It is mainly delayed responses you need to worry about. FAIR principles, perhaps combined with other strategies for topping off excess financial savings, are today likely the only option for making a transition to a thriving climax without major disruption.
Fig 4, The high risk of delay in responding to exponential threats. From Models Learning Change (Henshaw 2010)
Origin of the FAIR Concept: A series of tweets 05/24/20 … and historically, from the work of JM Keynes, 1935 General Theory, Chapter on “Sundry Observations on the Nature of Capital” Chapter – 16 III & IV, describing why the natural financial climax of the economy requires financial savings to climax to prevent the very worst effects of capitalism, implying that the wealthy need to learn to spend rather than save their profits to preserve them, by making the system as a whole sustainably profitable.
This is a preview of my new submission to Ecological Economics Please have a look at and comment on the review copy FYI Some of the figures and captions are below
Jessie Henshaw sy@synapse9.com
<<<<<<<<<<<<<>>>>>>>>>>>>
Abstract: Organized human and natural systems generally develop by an observable process of growth, with a beginning, middle, and end. Examples range from the growth of organisms, cultures, and ecologies to that of businesses, social movements, weather systems, even personal and social relationships, and many more. Close observation reveals organizational growth to be a progressive building process of self-organization. Most recognizable are its recurring three shifts in direction, each followed by a development period. That six-stage pattern can guide the study of a growth system’s internal and external designs, recognizable as a series of milestones along an “S” curve assembly line. That common model allows useful comparison of all kinds of natural and human-designed growth systems, using a diagnostic as opposed to a deterministic research method, keeping what “ought to be” in close association with “what is.” Discussed are the historical roots of the field, a set of pattern recognition tools, three brief pedagogical case studies, and an eco-economy view of our global growth and its natural time to turn.
<<<<<<<<<<<<<>>>>>>>>>>>>
ow living systems develop their complex organizational designs by rapidly evolving self-guided growth processes has fascinated scientific observers for millennia. Natural growth also still resists scientific definition though. Perhaps the delay comes from scientists asking the wrong questions, looking for deterministic rules for nature’s creative processes, rather than generative patterns of natural design.
Here we start from the broadest patterns, like how growth processes are evident throughout nature, even in every kind of work people do. Growth generally displays a three-part development cycle of beginning, middle, and end, but like a tree expands on opportunistic rather than deterministic pathways. Our problem with understanding it, then, might come from having so singularly studied nature for the deterministic patterns we can rely on, pushing aside the study of nature’s indeterminate building processes.
Another commonality is that whether it’s the growth of a mammal, a business, or a snowflake, the ultimate end is a state of complex perfection of design. On close inspection, that highly organized end-state seems to come from having alternating periods of diverging then converging (positive and negative) development feedback, first getting growth to start-up to then turn to perfect the design as growth finishes-up, as if generating a framework then filling it in.
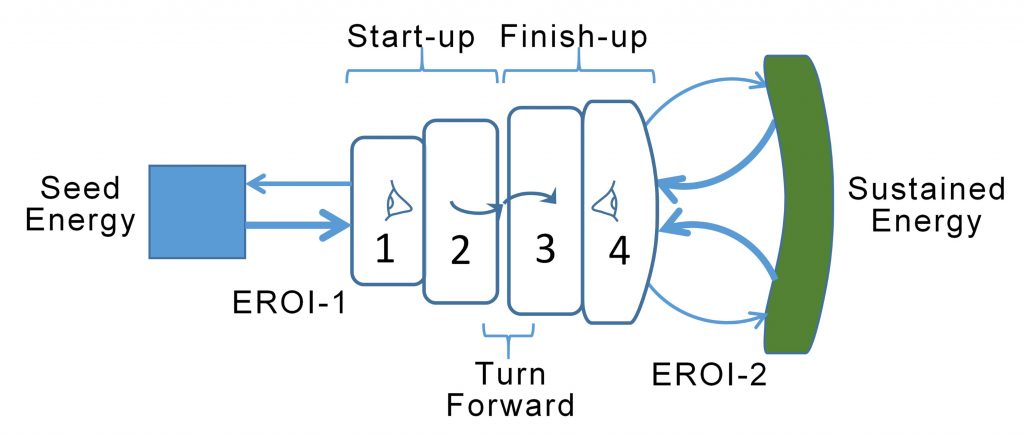
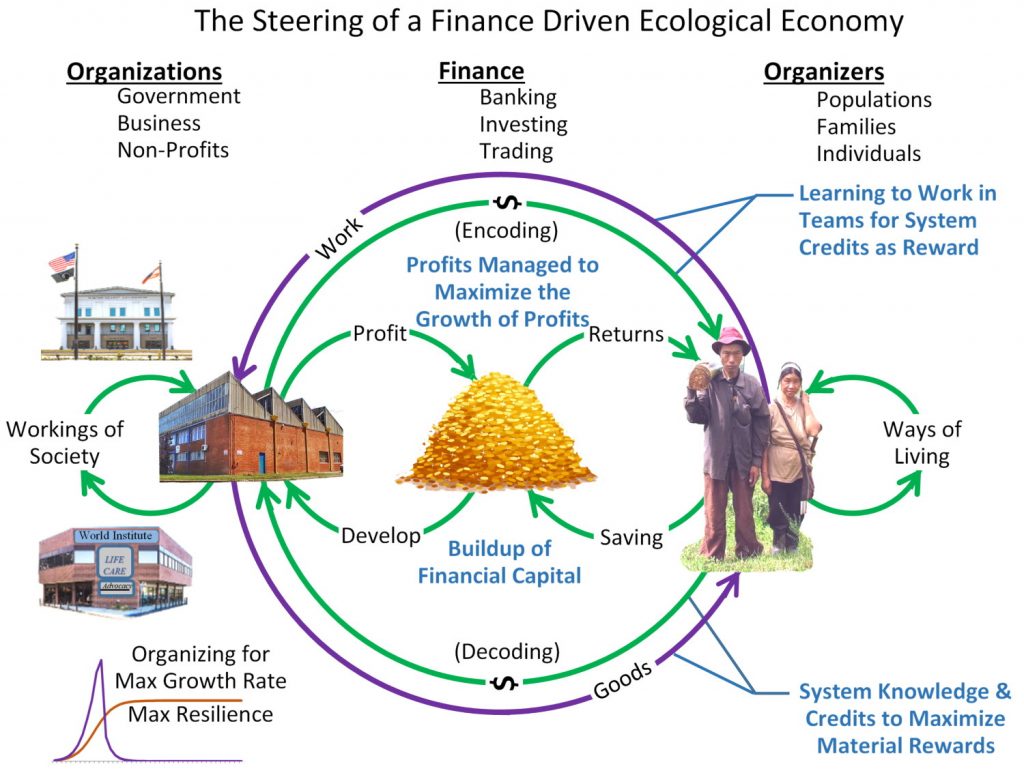
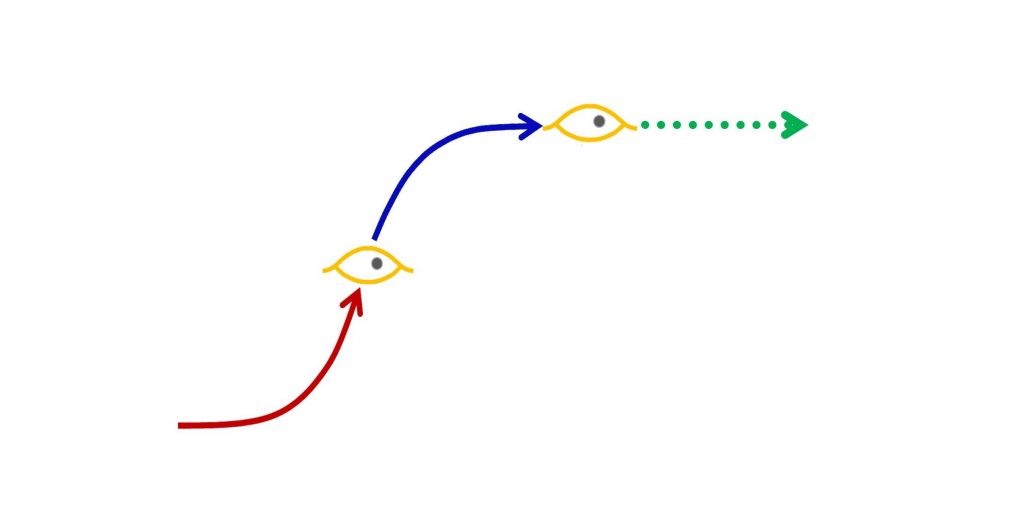
fig 1 – A Snowflake and its Central Kernel: Look at the layers of its kernel that built up around central dot. The first hexagonally differentiated shape you can easily see is still quite simple, but the next layers become quite complex. The six spines that emerge develop nearly identical filigree as if originating from an organizationally “entangled” first crystal core.fig 4 – Three stages and three turning points of natural growth. 1) the seed event, Image, and following start-up growth period (red) – Individuation 2) the turn forward event, Image, and finish-up growth period (blue) – Maturation 3) the arrival event, Image, and Climax life period (green) – Fulfillmentfig 5 – Economic systems need to use energy to harvest more energy. The ratio is called EROI, a ratio of returns to costs and has to stay greater than one for the system not to shrink or collapse. Usually, a new system’s first energy source, EROI-1, is consumed as the system develops a more lasting resource, EROI-2. Succession from one resource to another can also be repeated (not shown), like climbing a ladder, or it may fail.fig 9 – In a finance-driven eco-economy, choices by businesses and investors determine the directions of future development, predominantly based on what will be most profitable in the short term, whether by serving of quietly manipulating the markets.
Every economy is also an ecology, both a self-organizing system of mutual benefits which also relies on having positive net resource flows; both beneficial design and net material profits. Together these two faces of natural systems make a complex whole one can study from many points of view, but rely critically on all its parts.
Networks of mutual benefits are mostly composed of organizational, design, and qualitative relations, like that a cup holds water, or that a fish swims, or whether someone knows how to work with you, or whether a shop serves its local culture. Those aspects of design, organization, and qualities have no numerical definition but create the systems of mutual relations on which the designs of life rely, Some may be products of nature and others of fine arts and crafts: a fine meal, a delightful garment, or a meaningful film as inherent benefits of life.
Those benefits of life are also needed for the systems that deliver the physical resource flows that market price and investment returns determine the investment in, letting one calculate the budgets by which our world economy is managed. So to understand any particular living system, one needs a clear-headed understanding of how those two sides work together.
A tour of the evidence, from the 1780 origin of the greenhouse effect through its the major post-WWII acceleration
A preprint of a pending journal article of the same name is here. It’s a fairly short but thorough study, a data story, using the climate science we all know, to trace how humans have long organized our use of the earth to maximize the growth rate of our economic intervention in the climate. That exposes the fatal flaw of nearly all promoted solutions, the boundless plan for doubling our total energy use about every 33 years. Every kind of energy use for replacing fossil fuels would still then need to repeatedly double its disruption of earth systems, overshooting all planetary limits. That was actually the problem with fossil fuels, that if we had stabilized our energy use by about 1960 we would not have exceeded the earth’s long term buffering capacity and there would have been no climate crisis.
In the following figure you can see it quite directly from the long periods of constant compound growth in atmospheric CO2, before WWII and after. The ancient CO2 data comes from from ice-core air samples, until 1958, and the modern data from mountain top air sampling after that. WWII is seen as halting the accumulation of CO2, and the period after when we globally reorganized the economy using advanced science, technology, institutional and government cooperation to maximize the economy’s exponential rate of expansion.
What this implies is that climate change is not really caused by CO2.
Rather the climate crisis is being driven by our constant haste to reorganize the economy again and again to expand its conversion of resources into dollars as fast as possible. That we are not changing that organizational design of the economy would then seem to be the reason we are unsuccessful in getting agreement on how to reduce the quantitative reductions in CO2.
What is needed is to include in the economy’s equation for profits the value of the material, ecological, environmental, and cultural resources of the earth. The trick is to start with what you can measure, make the units “shares of the total,” and work to measure more. That would lead to a fuzzy but holistic and complete map of where we are really going economically. For reference, a model for that was proposed for inclusion in the UN’s SDGs in 2014, called “the World SDG.”
Blurb: The leading sciences offer a pattern language for nature in the form of interrelated mathematical equations. Scientifically undefined natural language remains needed for referring to and discussing the rich self-defined patterns of organization found in nature and discovering their roles in our lives. Those include general multi-scale patterns of ‘cellular organization,’ ‘mediums,’ ‘homes,’ ‘growth,’ and ‘cultures,’ and are among the guiding patterns of naturally occurring design this pair of revised 2015 papers explore.
The author’s effort is to bring together her long studied natural science pattern language of emergent organizational growth and climax transformations with Christopher Alexander’s pattern language of holistic architectural design, to be a resource for a combined design-science point of view. The discussion does not rely on a detailed study of either precedent. It relies instead on the reader’s own experience with and ability to recognize naturally occurring patterns of design. The text is arranged as a series of short essays, combining introductory and advanced issues, that one may read through or pick up to read and reread a piece at a time.
Vita: – BS in physics – St. Lawrence Univ., post-graduate math courses – Stony Brook & Columbia, architecture & landscape design MFA – Univ. of PA. A mix of rich experience and field study of energetic patterns of organization in emergent microclimate & other growth systems, showing how after growth the vitality of systems is sustained to make life so lively.
…. One of the more curious things about nature is how obvious it is that every natural design develops by its own individual growth process, building up from an initial design pattern and emerging as a whole as it runs its course. That applies to a storm, a volcanic eruption, a lightning strike. It also applies to smaller scale life systems, such as for personal relationships or conversations, human or other plant or animal lives, civilizations, ecologies, and of course businesses and economies. The living systems for which growth is a holistic building process, preparing them for long lives after growth, all start by organizing and expanding faster and faster at first, and then shift gears to develop slower and slower, refining and coordinating their designs to climax when ready to begin their long lives ahead. It’s a switch from scaling up the starting patterns to then take a sustaining role their environment.
… If that understanding, of how to succeed in life after growth, were to spread around the world, it could dramatically change our now doubtful future. Today our chances are compromised by our global inability to stop our ever growing our consumption, disruption, and confusion of life on earth, not knowing how to smoothly switch from the red to the blue curve, to get ready for a long life.
The natural arc of successful life stories, 1) building, 2) refining, 3) life. the universal pattern of: Innovation – Refinement – Enjoyment
“California suffers greatly because the best elements of the population fail to cooperate for the common good as effectively as the bad elements cooperate for evil purposes.”
He then goes on to eloquently advocate and express confidence in the higher purposes of American society to heal our troubled world, to bring peace and justice to the world. But life is not a simple contest of good and evil. That’s a simple problem to solve, just let people join the side doing good.
What seems mistaken is portraying the evil of the world as being an absence of people doing good. As with the German holocaust of the 1930s and 40s. It is historically common for people who feel themselves to be doing good to then lose control of their societies, not realizing till much later they were doing great evil. In authoritarian societies, the leader commonly appears misled by the results of using their power to multiply their power, unaware of how very societally destructive their own behavior will become. That mechanism also applies to investors and governments now using wealth to multiply wealth, unaware of how destructive to the earth that will become. For the people in the societies doing the growing harm, like ours, “life seems normal”.
The larger difficulty is a “problem of normality”.
It’s almost too offensive for people to consider that their own good intentions and their own good feelings of cooperation in working together for the common good could be susceptible to evil. Examples of societies acting in complete contradiction to their own cultural values, and people having their good intentions twisted to evil purposes, seem like they must apply to “someone else”.
The author of the 2006 paper,Emergence and Evil, in the systems science journal E: CO, nicely documents in intimate detail how teams of good scientists, while living very normal academic & professional lives, also devoted their talents to making smallpox more contagious than it naturally is, for use as an efficient weapon. That is a hideously evil thing to do. The Soviet biological weapons program is also well studied from other views, usually addressing it from the simplistic “good v. evil” perspective. The real problem was good AND evil, a true evil that is not so simple, one taking the reader inside what true evil is. You find how very “normal” it is and how “good as evil” is the real problem behind people cooperating socially for evil purposes, like destroying the earth.
Working energetically for what we hate
That your social relations within a society “can feel good” while your labors are “doing evil” is the problem.
There’s some kind of “disconnect” between what makes us feel good about our work, that fools us about the nature of what our societies are doing as a whole are doing with it. As soon as you realize the nature of the relation, it’s fairly obvious why it’s a problem. It’s that the cells of an organism have a completely different environment from the body, and as cells of the human body, people are rather unobservant. That seems to be the “disconnect.” The cells of a body have their common genome that helps guide each one to act in the interest of the whole, but for quite a number of reasons, our social lives don’t have that for our societal lives.