
A tour of the evidence, from the 1780 origin of the greenhouse effect through its the major post-WWII acceleration
A preprint of a pending journal article of the same name is here. It’s a fairly short but thorough study, a data story, using the climate science we all know, to trace how humans have long organized our use of the earth to maximize the growth rate of our economic intervention in the climate. That exposes the fatal flaw of nearly all promoted solutions, the boundless plan for doubling our total energy use about every 33 years. Every kind of energy use for replacing fossil fuels would still then need to repeatedly double its disruption of earth systems, overshooting all planetary limits. That was actually the problem with fossil fuels, that if we had stabilized our energy use by about 1960 we would not have exceeded the earth’s long term buffering capacity and there would have been no climate crisis.
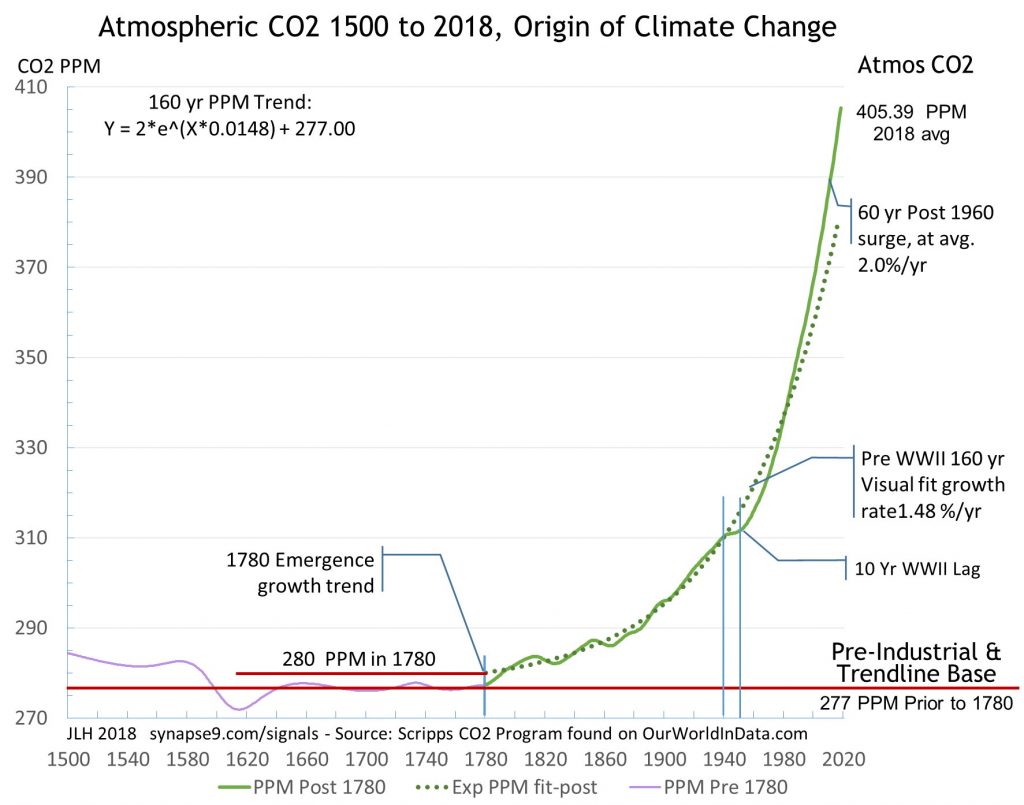
In the following figure you can see it quite directly from the long periods of constant compound growth in atmospheric CO2, before WWII and after. The ancient CO2 data comes from from ice-core air samples, until 1958, and the modern data from mountain top air sampling after that. WWII is seen as halting the accumulation of CO2, and the period after when we globally reorganized the economy using advanced science, technology, institutional and government cooperation to maximize the economy’s exponential rate of expansion.
What this implies is that climate change is not really caused by CO2.
Rather the climate crisis is being driven by our constant haste to reorganize the economy again and again to expand its conversion of resources into dollars as fast as possible. That we are not changing that organizational design of the economy would then seem to be the reason we are unsuccessful in getting agreement on how to reduce the quantitative reductions in CO2.
What is needed is to include in the economy’s equation for profits the value of the material, ecological, environmental, and cultural resources of the earth. The trick is to start with what you can measure, make the units “shares of the total,” and work to measure more. That would lead to a fuzzy but holistic and complete map of where we are really going economically. For reference, a model for that was proposed for inclusion in the UN’s SDGs in 2014, called “the World SDG.”
JLH