A change in natural science is emerging along with “computing”
turning away from using theory & equations as a guide,
toward using data pattern recognition for
naturally occurring systems revealed in the data to be a guide.
Preface
Note: About 20 Years ago algorithms were developed for selectively extracting differentiable continuities from raw data, making a major step beyond “splines” for true mining of natural continuities from noisy data without regression. The result was quite successful forensic pattern recognition of discovered natural systems, their forms and behaviors. Combined with a general systems “pattern language” based only on the constraint of energy conservation, that pattern mining has provided a very productive alternative to AI for investigating naturally occurring forms and designs. The one unusual leap for applying scientific methods was to use it to capture the great richness of natural textures available from studying uniquely individual cases and forms found in nature. That is what overcomes the worst faults of studying individual cases, and so instead greatly enriches theory with directly observed phenomenology. The rudimentary tools successfully developed have been proven useful again and again with subjects such as illustrated below. 10/21/16
_________________________
A long central principle of modern science, relying on defining nature with the information we can find, is considered here by way of eight examples of how important it is for science to also rely on doing the opposite, looking for patterns in the information we are missing somehow. Doing much the reverse lets us use the information we have to ask better questions about what nature is hiding from us.
It’s such an odd and obvious mistake to stubbornly treat nature as our data, as Neils Bohr and Popper insisted on and the QM community has maintained. Being limited to analysis and data creates a large blind spot for science, made unable by that limitation to learn from observation, and to see clearly how very different the “data world” (what fits in a computer) is from the “material world” (what doesn’t). The puzzles of found in natural patterns, turning up in ‘bigdata and various pattern sciences seems to be putting all of these matters into question again.
So I may take some unfair advantage, perhaps, by making a little fun of that prior arbitrary constraint on scientific inquiry, insisting that nothing we have no data for can exist. That of course is almost everything when it comes down to. It’s no joke, though, that our data is decidedly inferior for defining nature. Here and elsewhere I tend to allow that nature defines itself, as I certainly don’t do it.
The “Impacts Uncounted” article mentioned describes a simply enormous worldwide neglect in economic accounting, a huge mismeasure of lasting business environmental impacts. It’s caused by the traditional insistence on trusting the data at hand and refusal to look for what data is going uncounted, as if the fact that we can only study the data we have means nature is not being misrepresented by it, a curiously deep concern for understanding the scientific method. In reality there is more to life than the data we have. Treating “science” as whatever our data defines, then, actually means “flying blind” regarding all the kinds and scales of phenomena going unmeasured, the difference between nature and data going unseen. For accurate accounting, even older scientific principles need to apply, such as defining units of measure in relation to the whole system or “universe” for that measure, not just the part easy to measure, and so “Impacts Uncounted” is the effect of counting the global impacts of business using local measures, as is today standard around the world, a big mistake.
So these 8 examples are “data visualizations” that neatly expose where important data is very much missing, as a guide to where to go and look. Those hiding places exposed as gaps in the data turn our attention to phenomena of perhaps another kind or another scale, or on another plane with material influence perhaps. That is then what needs to be discovered and looked into. to really understand what the measures display and the systems or events they refer to. That the data available, then, always points to phenomena beyond the scope of the data to define is both the oldest and perhaps now the newest of deep scientific principles for interpreting what we see.
Is science coming full circle…? The answer seems to be YES!
Persistent patterns in data generally reflect complex natural forms of design, complex and complicated well beyond what data can define. So we present data in a way to helps show someone what’s missing.
Data from a natural source is generally biased and incomplete as a result of how it’s collected, and a “proxy” for various things other than what it is said to measure. So not really knowing what it measures, it is best studied as being another way of sampling an undefined universe, to become meaningful by discovering its boundaries
Patrick Ball’s HRDAG[1] methods demonstrate comparing sources for death records in conflict environments, using the differences and overlaps to reveal the true totals. My own research shows environmental impacts of business are undefined, lacking a common denominator to make them comparable as shares of the same universe. Correcting the mismeasure appears to increase the impact scale of business by several orders of magnitude[2]. In both cases characterizing the universe the original data is implicitly sampled from serves as common denominator for making the original data meaningful.
For discussing basic explanatory principles of physics used for forensic systems research[3]
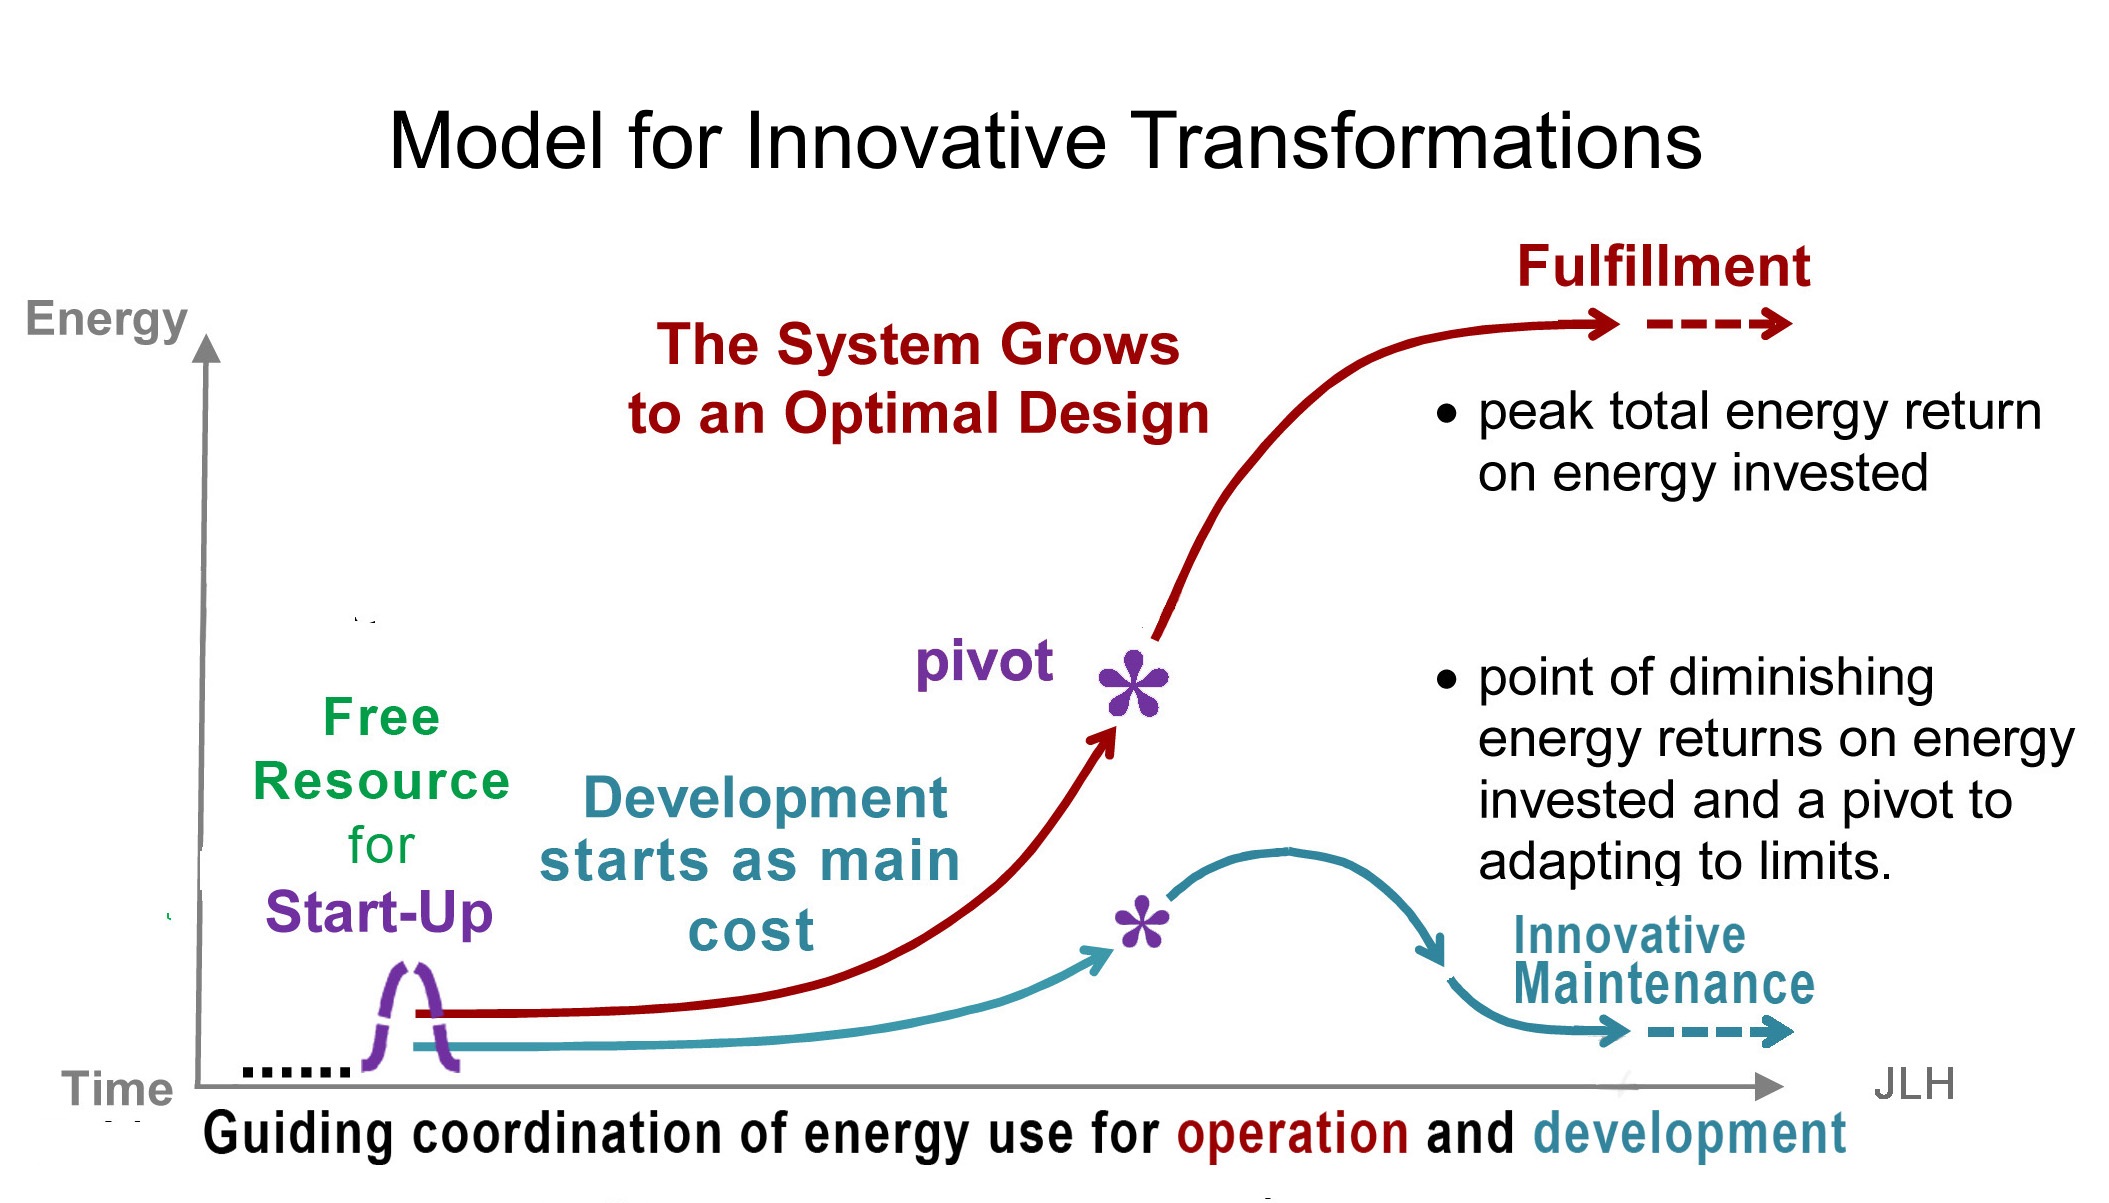
1. See where hidden connecting events shifted the flows??
[The missing data is about the unstable states, the markers of whole system change in design]
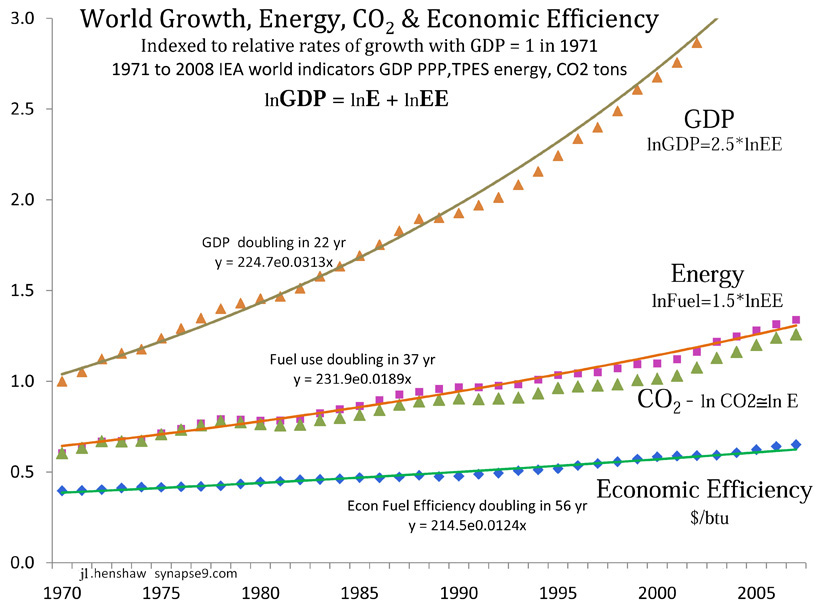
2. See where hidden connecting events shifted the flows??
[The missing data is in how GDP’s and Energy use of countries coordinated, so the world’s became so smooth]
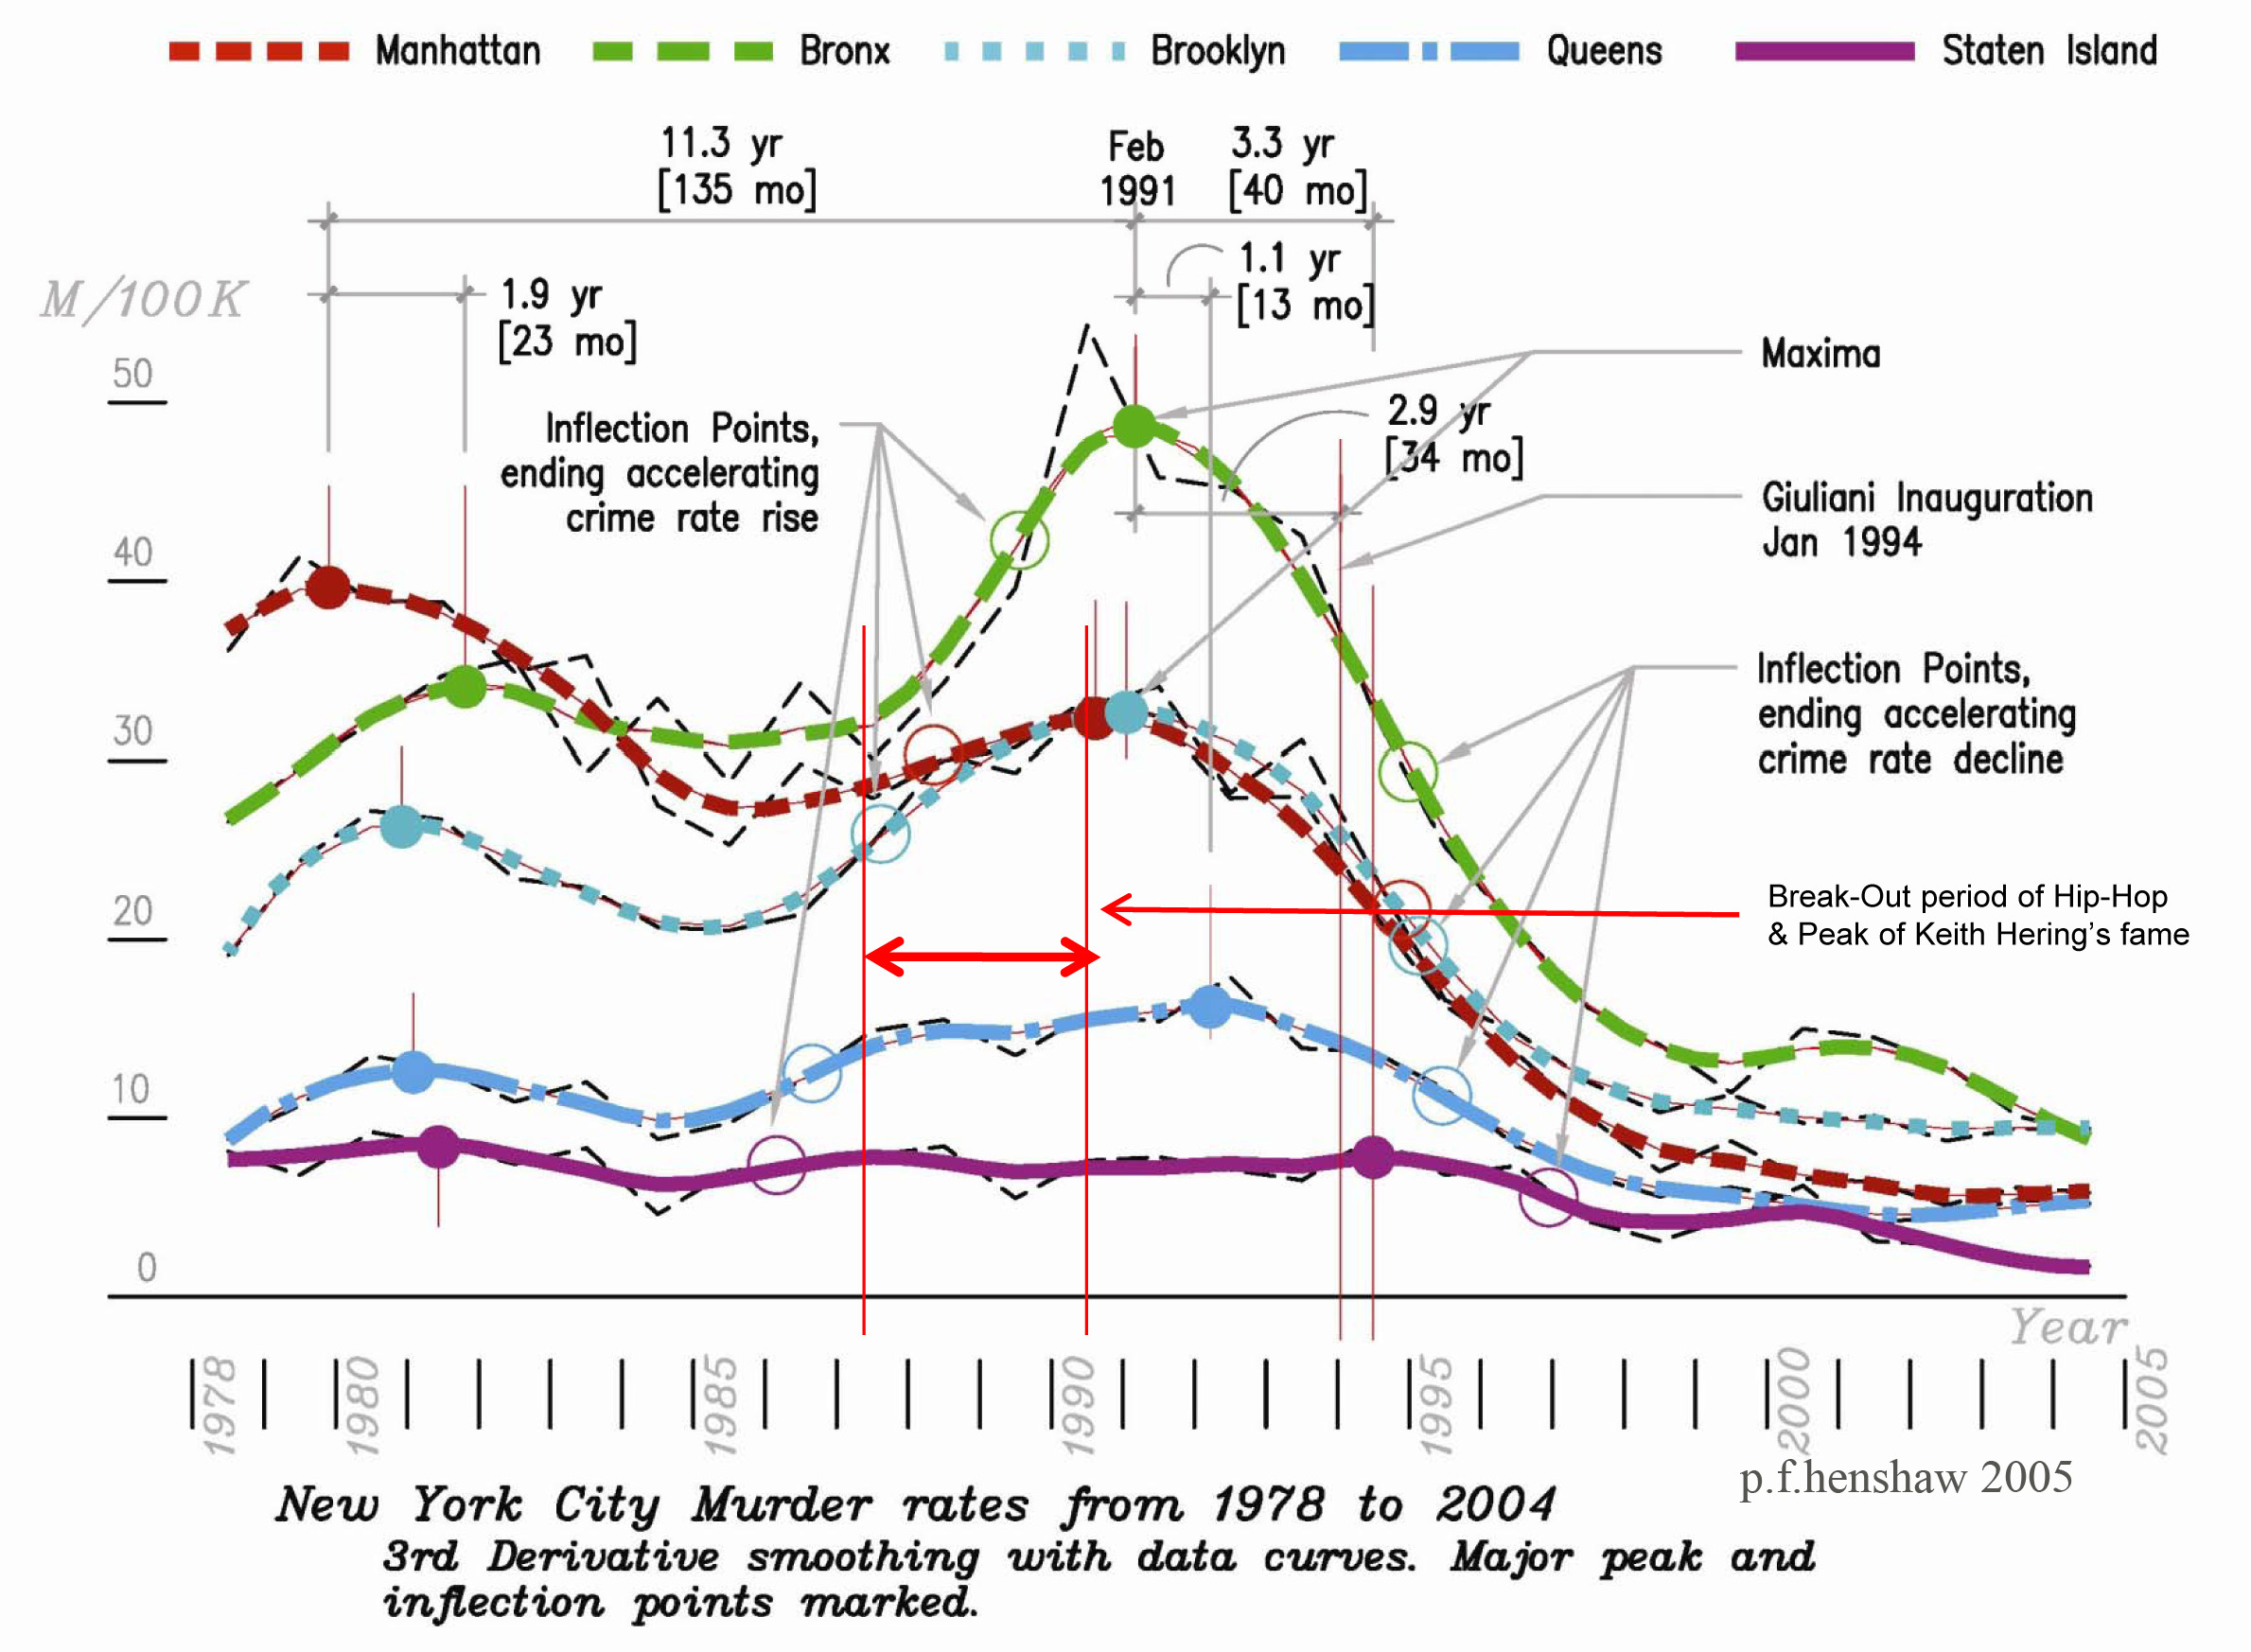
3. See where hidden connecting events shifted the flows??
[The missing data is in the dramatic collapse of Bronx crack epidemic murder rates long before the inauguration of the politicians taking credit for it]
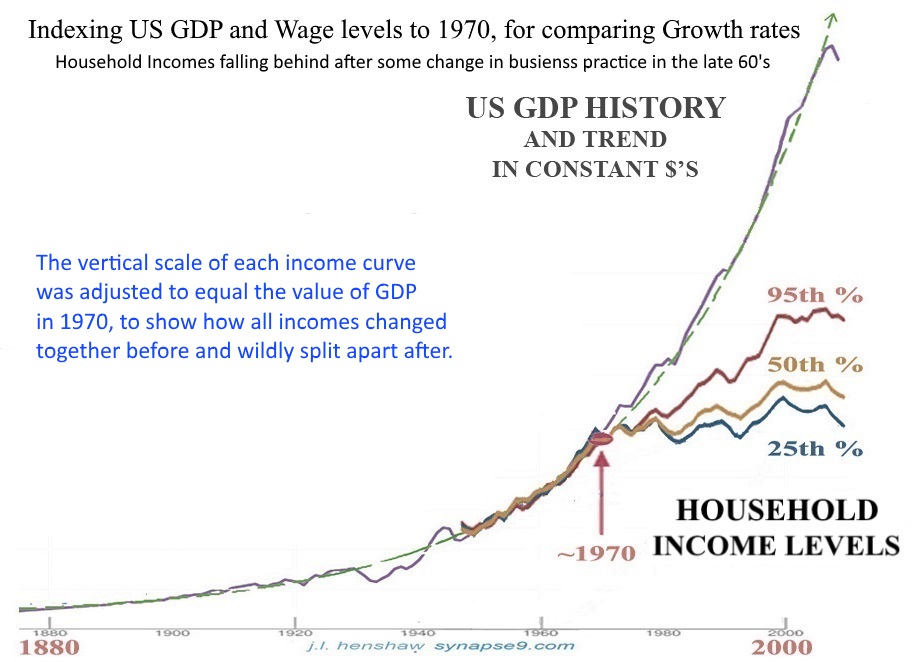
4. See where hidden connecting events shifted the flows??
[The missing data is about the sudden whole culture change in how businesses operated at 1970]
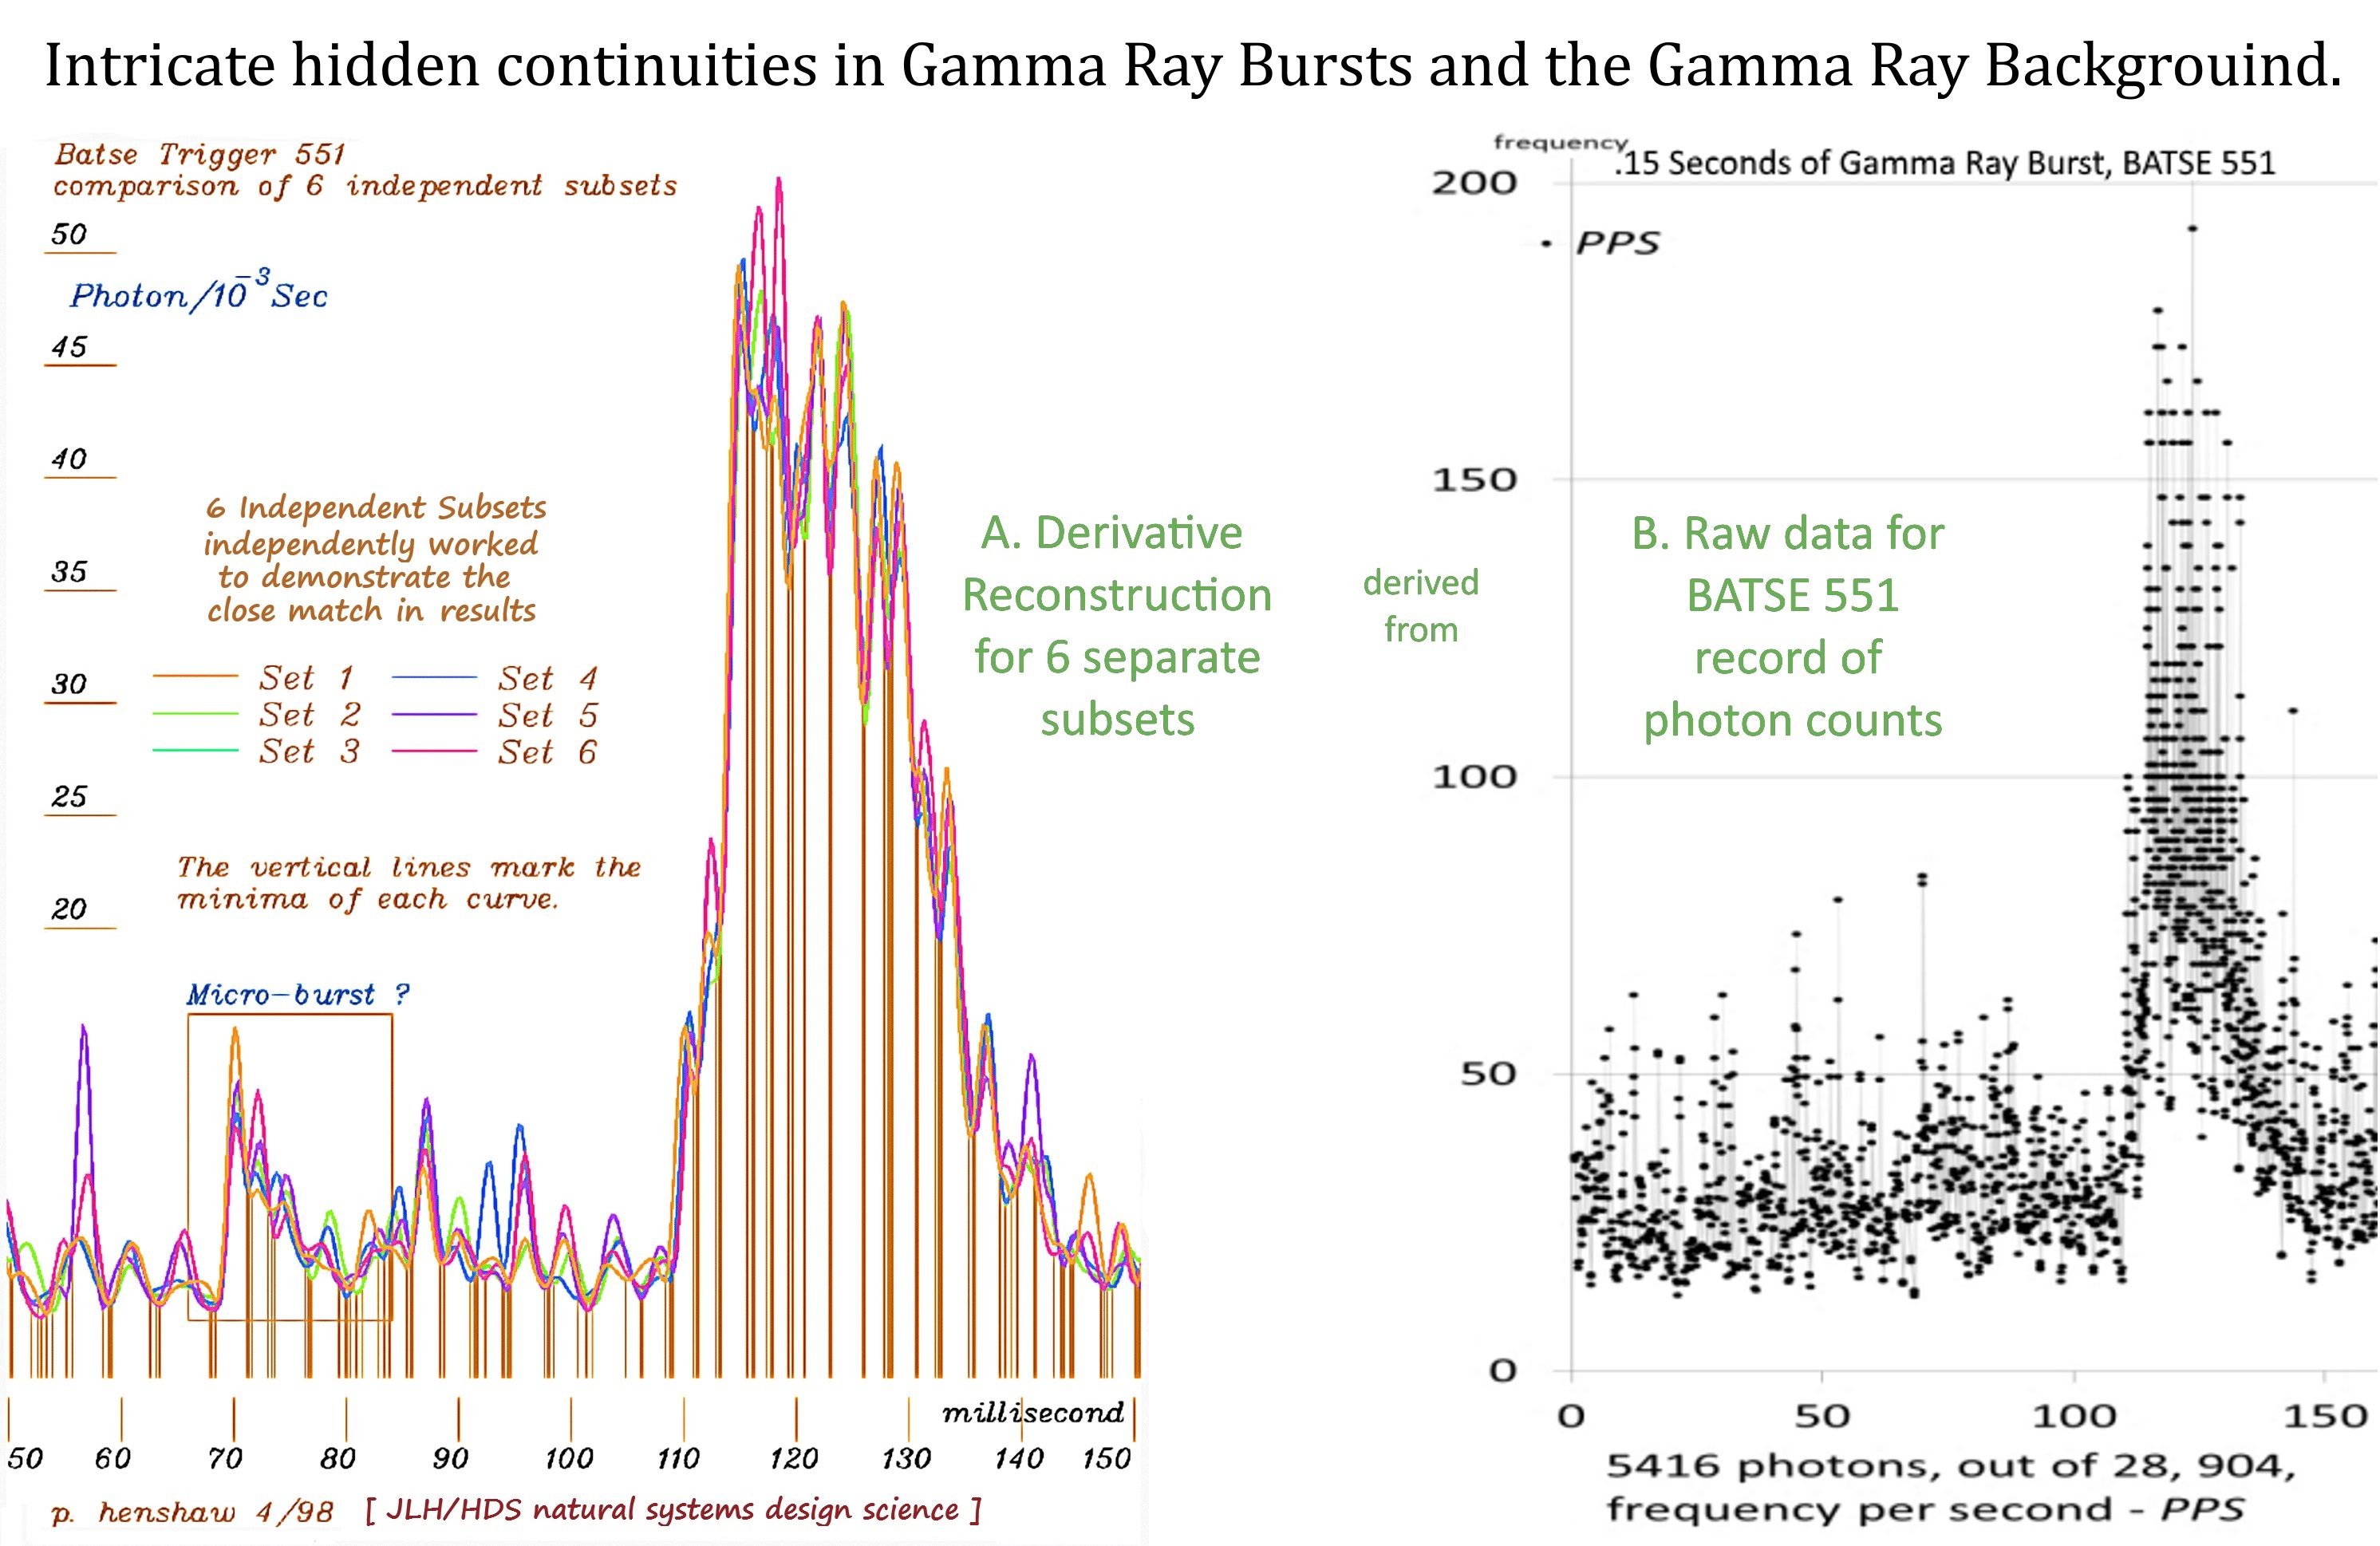
5. See where hidden connecting events shifted the flows??
[The missing data is the nature of these intricate flows, evident in all six statistically independent subsets of the recorded data, assumed to be random.]
6. See where hidden connecting events shifted the flows??
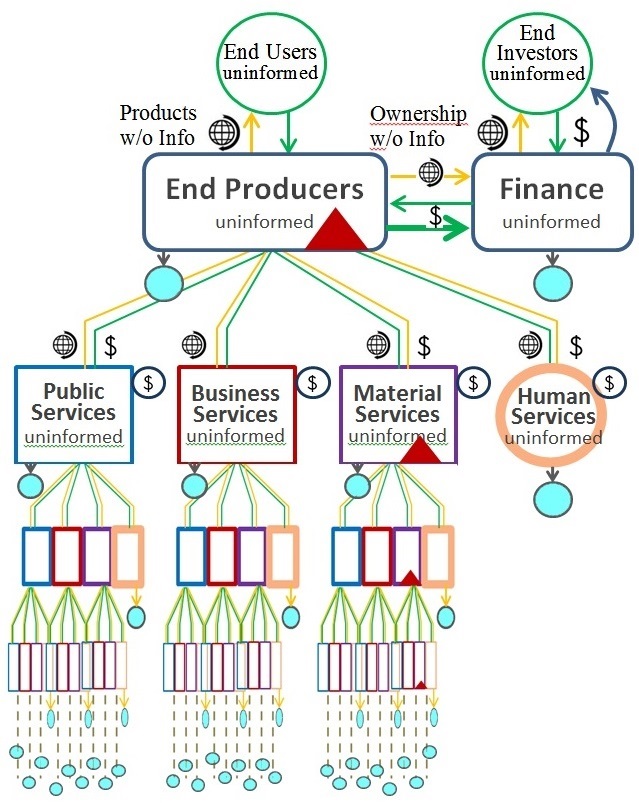
[The data missing from our ESG “source maps” of business environmental impact is ALL the blue dots, human consumption by business people not passed up the chain]
7. See where hidden connecting events shifted the flows??
[The missing data is where the investment money went to be more profitable, dumping local agriculture one place for the next, now being left behind too]
8. See where hidden connecting events shifted the flows??
[The missing data is what links the “unhidden pattern of events”]
The natural stages of continuity in energy use, linked to the working organization of growing and ending relationships at each stage (1,2,3,4,5,6)
Eventful organizational transitions i, ii, iii, iv, v & vi (tipping point changes)
Markers of shifting relationships as the life/environ system proceeds from one natural threshold to another in the life succession ]