UN meetings on the first year of SDG implementation are over now, were very intense, and in the end quite successful for finding a new way to discuss the neglected issue of natural limits. The scientific community that understands the connection between our natural limits and economic growth has been totally shut out of the UN discussion for years. I didn’t get to speak to the main body on that directly, but I finally found a way to talk about the problem, that the SDG’s don’t in any real way count the global impacts of our decisions:
The ISO’s world environmental accounting standards fail to honor its fiduciary duty to our interests and human right to honest data,
only counting local impacts, leaving all global impacts of financial decisions uncounted and unaccountable.
SD decision makers are the most hurt, kept from knowing most of what they are deciding.
____________
The 17 Goals
It had seemed I would have a chance to speak at the UN, officially representing the long neglected interests of the scientific community that understands the coupling of the economy and natural limits. Below is the email I sent a number of scientists and other experts who understanding is not being represented:
Friends,
I found a way for scientists who have long understood natural limits, to get official representation at the UN, in the UN’s community of CSO’s (Civil Society Organizations), as a member of its “Major Groups and Other Stakeholders” (MGoS). The present work is the review and guidance of the UN’s global Sustainable Development Goals project (SDG’s), and the High Level Political Forum’s (HLPF) oversight of it. https://sustainabledevelopment.un.org/hlpf
Please circulate widely. Non-expert members welcome too. There is no organization at this time, just me seeing an opportunity to have our long neglected interests given official recognition. I might start a Google Group with the names or something… Any statement would be in the interests of the group rather than as if representing a group position
The draft text for representing the group’s interest to the UN is is here.
Time was too short for it to get around, and response was slow, except for the two great ones I really appreciate getting, so I turned off the Google invitation form . It still seems to be something that community really should find a way to do though!
The following is written for circulation in the “data science” research communities, on some advances in scientific methods of system recognition I’d like to share. It starts with mention of the very nice 9 year old work published by Google on “Detecting Influenza Epidemics using search engine query data” taken from a letter to that paper’s authors. Take the reference to be to your own work, though, as it involves system recognition either in life or exposed by streams of incoming data.
empirical evidence of systemization
I expect a lot of new work has followed your seminal paper on detecting epidemics as natural systems.
But are there people starting to focus on more general “system recognition”,
studying “shapes of data” that expose “design patterns” for the systems producing it?
Any individual “epidemic” is a bit like a fire running it’s course, and sometimes innovating the way it spreads. That change in focus directs attention to how epidemics operate as emergent growth systems, with sometimes shifting designs that may be important and discoverable, if you ask the right questions. You sometimes hear doctors talking about them that way. In most fields there may be no one thinking like doctors, even though in a changing world it really would apply to any kind of naturally changing system.
Turning the focus to the systems helps one discover transformations taking place, exposed in data of all sorts. One technique allows data curves to be made differentiable, without distortion. That lets you display evidence of underlying systems perhaps entering periods of convergence, divergence or oscillation, for example, prompting questions about what evidence would confirm it or hint at how and why.
Focusing on “the system” uses “data” as a “proxy” for the systems producing it, like using a differentiable “data equation” to closely examine a system’s natural behavior. In the past we would have substituted a statistic or an equation instead. By prompting better questions that way it makes data more meaningful, whether you find answers right away or not. I think over the years I’ve made quite a lot of progress, with new methods and recognized data signatures for recurrent patterns, and would like to find how to share it with IT, and collaborate on some research.
Where it came from is very briefly summarized with a few links below. Another quick overview is in 16 recent Tweets that got a lot of attention this past weekend, collected as an overview of concepts for reading living systems with bigdata.
I hope to find research groups I can contribute to. If you’re interested you might look at my consulting resume too. If you have questions and want to talk by phone or Skype please just email a suggested time.
Working with BigData, especially learning how to read the designs and behavioral patterns of the earth’s natural systems, its living cultures of all kinds, and to sense our roles in them, opens up a tremendous new field of understanding. It of course also opens up very new kinds of perspectives to puzzle over, both offering to show us new paths and making it clear various reasons to question what we’ve been doing.
This series of Tweets came out in a group somehow, mostly in this sequence today, seeming to build a framework of interconnecting points, like tent stakes and poles maybe, a design for hosting ways to do it. ……Jessie
What we talk about becomes society’s reality, so we can read #BigData for what’s happening #following_all_cultures and #resources_on_earth.
And what may matter most in #BigData is going from reading abstract patterns to reading naturally occurring ones. http://synapse9.com/jlhCRes.pdf
Then add the magic of learning to read the patterns #BigData reveals, as exposing the designs of the natural systems producing it.
Reading #BigData for natural patterns shows you even the best data doesn’t show what systems are producing it.
No degree in #data_science will neglect pattern recognition for understanding the natural systems creating the data.http://www.synapse9.com/pub/2015_PURPLSOC-JLHfinalpub.pdf
If our world #economy is causing trouble for the #earth, why do we think it helps to speed it up? #Get_real_people!
Escher
Are @google, @IBM or other #BigData #research teams learning how to read design patterns of natural systems?? http://synapse9.com/jlhCRes.pdf
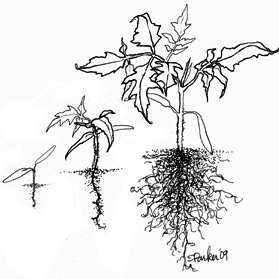
To start reading natural systems in #bigdata look for cultures made individually, clustering or growing from seeds.
from PURPLSOC 2016 http://www.synapse9.com/pub/2015_PURPLSOC-JLHfinalpub.pdf
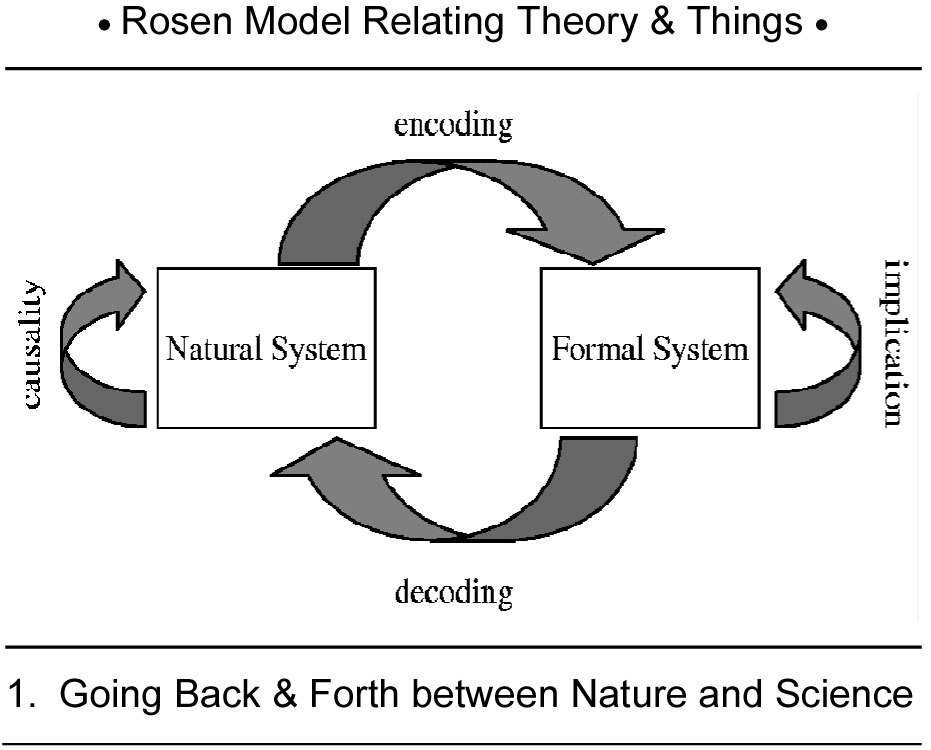
Then follow recognizing nature’s cultures with learning from them, going back and forth between models
from PURPLSOC 2016 http://www.synapse9.com/pub/2015_PURPLSOC-JLHfinalpub.pdf
When reading #bigdata for behaviors of cultures also note contradictions in the news, like #jobs_going_to_Mexico and #refugees_escaping_too.
#BigData exposes surprising whole system views too, #professionals managing systems of growing inequity, disruptive change and impacts too.
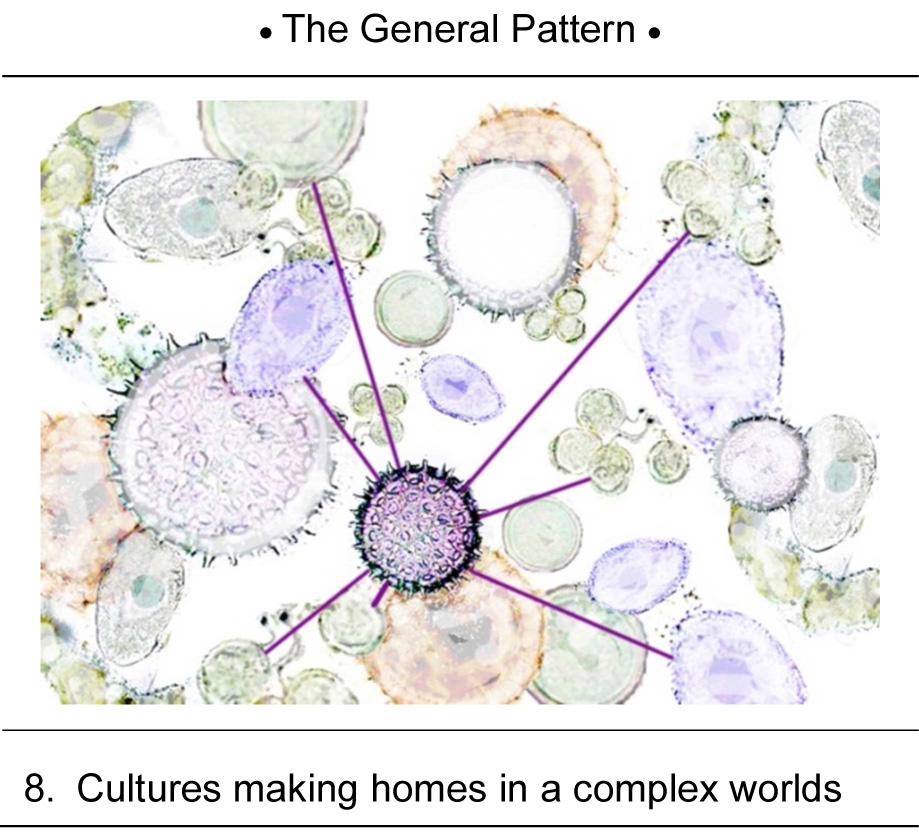
#BigData reveals living cultures: business, economic, social, biological or ecological, etc. all either: homeless, home seeking or enjoying.
As you see their forms you realize two things:1) our world is very #alive and 2) most #bigdata is too “big”, making you look for other views
To read #bigdata as views of shifting cultures, alone or together, pushes a #whole_system_view for units of measure. http://synapse9.com/signals/2014/02/26/whats-scope-4-and-why-all-the-tiers/
A #whole_system_view, like #studying_the_camera not what’s in its view, is how to start seeing ourselves in the data!http://www.synapse9.com/jlhpub.htm#ns
Sixteen Tweets on reading our world in #BigData, it’s many moving parts, units of measure & big recognitions required.
ed note: One tweet, that became #11, was rephrased and put in a more logical location a few hours after the first posting.
…. The distinct possibility is that, for the first time:
Science might soon be able to study all the objects of nature, in their innate form
not just the models we make based on what data is available…
______________________
In-depth Pattern Language Research
“Guiding patterns of naturally occurring design”
1) For PURPLSOC 2015: on “Elements” (final for publication)
2) For PLoP 2015: on “Mining living quality” (meeting draft)
______________________
To recognize
Individual organizations, Complex natural designs, Emergent forms of naturally occurring design,
Evolving organization & behavior of complex whole systems,
Discovering more and more of the hidden interior designs of lively whole systems…
One way of introducing the “what” and “how” comes from a “pattern language approach” to the science of “naturally occurring systems”, presented in a paper for PURPLSOC:
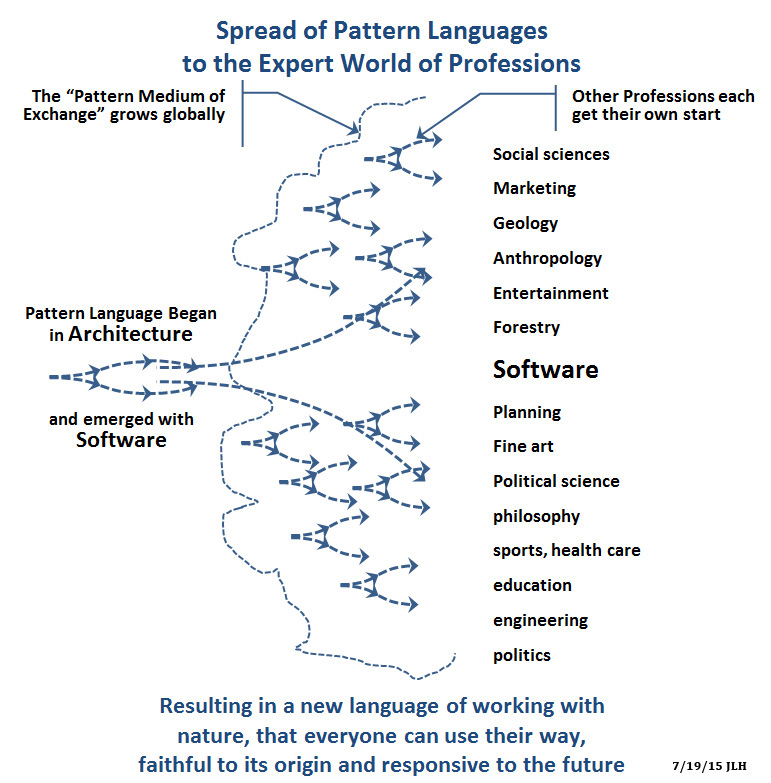
Pattern Language becoming a general language of object oriented thinking and design in all fields.
Guiding Patterns of Naturally Occurring Design: Elements
that I presented at the July 3-5 PURPLSOC pattern language research meeting in Krems Austria. It was in a group of papers on pattern language as a general science; with papers by Helene Finidori, Helmut Leitner,Takashi Iba Et. All.; Christian Aspalter & Reinhard Bauer. (links to follow)
As an approach to working with natural systems “Guiding Patterns of Naturally Occurring Design: Elements” seems unprecedented in using a fully scientific method for focusing on the “objects of nature”, using a pattern language approach to identify working complex relationships of natural designs, in their natural contexts, with nothing “held equal” or represented with models, a practical way to relate to the “things themselves”, as “known unknowns”.
The key is not to avoid data and models. It’s not to rely to heavily on them. It’s to just never use them to represent natural systems, but only to help you discover why naturally occurring systems and their complex designs are of real interest, and doing things quite different from theory. It turns out that Christopher Alexander’s pattern language, as a structured language for discussing holistic solutions, as designs for recurrent problems, has now evolved to let it jump from one profession to another. So, if the branches remain connected to the root… it seems to make a good foundation for building a new language of science, one that doesn’t replace nature with the abstractions of boundless theory.
The paper is a “sampler” of explorations of the topic, including an advanced “starter kit” of methods, terminology and examples, for how to use the patterns of natural design to guide efforts at intentional design and integrate with our world of natural systems. It introduces a way of recognizing natural designs as ‘objects’ in nature, with their own individual boundaries, allowing separate discussion about what goes on inside and outside, and using pattern language (not abstract models) to make verifiable sense of it. Identifying a boundary is what permits considering what goes in and out, and open up the use a traditional use of terms of physics and economics, for understanding the thermodynamics and the coupling between energy budgets and financial budgets, etc. for natural systems. Based on that, it would appear to make a true “object oriented science” a practical possibility.
The original paper introducing this from a traditional biophysical scientific point of view, as “Whole Systems Energy Assessment” (5). That paper can perhaps now be understood if interpreted from a pattern language viewpoint, as showing that shares of GDP measure shares of global impacts of delivering GDP… The economic system does appear to work as a whole, and the effort to validate that seems to successfully result in a far more accurate, and far more actionable, measure the impacts of our choices than efforts to directly trace economic impacts can produce.
For the translation of these and related natural system principles to the language of Alexander’s “pattern language” for defining “object oriented” principles of holistic design see the 2015 “Guiding patterns of naturally occurring design” papers for PURPLSOC (Pursuit of Pattern Language for Societal Change) (Jul 5 2015) (1) and PLoP (Pattern Language of Programming)(Oct 23 2015) (2) and related slides and supplementary materials (3). Also in the directory is a YouTube video link to the first 15 minutes of the slide narration, for the July 5 presentation of ‘Elements’, salvaged from a cell phone recording (4).
Need to update & add notes and discussion on both conferences….
It was reallyexciting to be part of, and to watch this new way of thinking emerge, PL as a whole system language for “designs of services” to balance and support
the traditional view of science as a whole system language for “defined controls“
We publicize the “special places” that are threatened, and people respond, yes. But we have to face that after 100 years of doing that, the environmental movement that our conservation groups and actions have been at the center of, has protected lots and lots of **special places** but is still not protecting the **ordinary places**.
Protecting thousands of special places, the ordinary places left unprotected
The effect of our organizing has been as if we didn’t know the ordinary places were just as threatened as the special ones, by the same visible and ever expanding encroachment from our economy. Don’t we need to get that straight? Don’t we need to be much more direct in saying that the threats to the special places (that get everyone’s attention) also symbolize the threat to the earth as a whole?
Places like Tucson we haven’t protected
If we do that it could materially change the common goal, recognition that really save the earth we need to **remove the threat**, not just **protect the things that symbolize the threat**. Isn’t that a change in view we need to bring about?
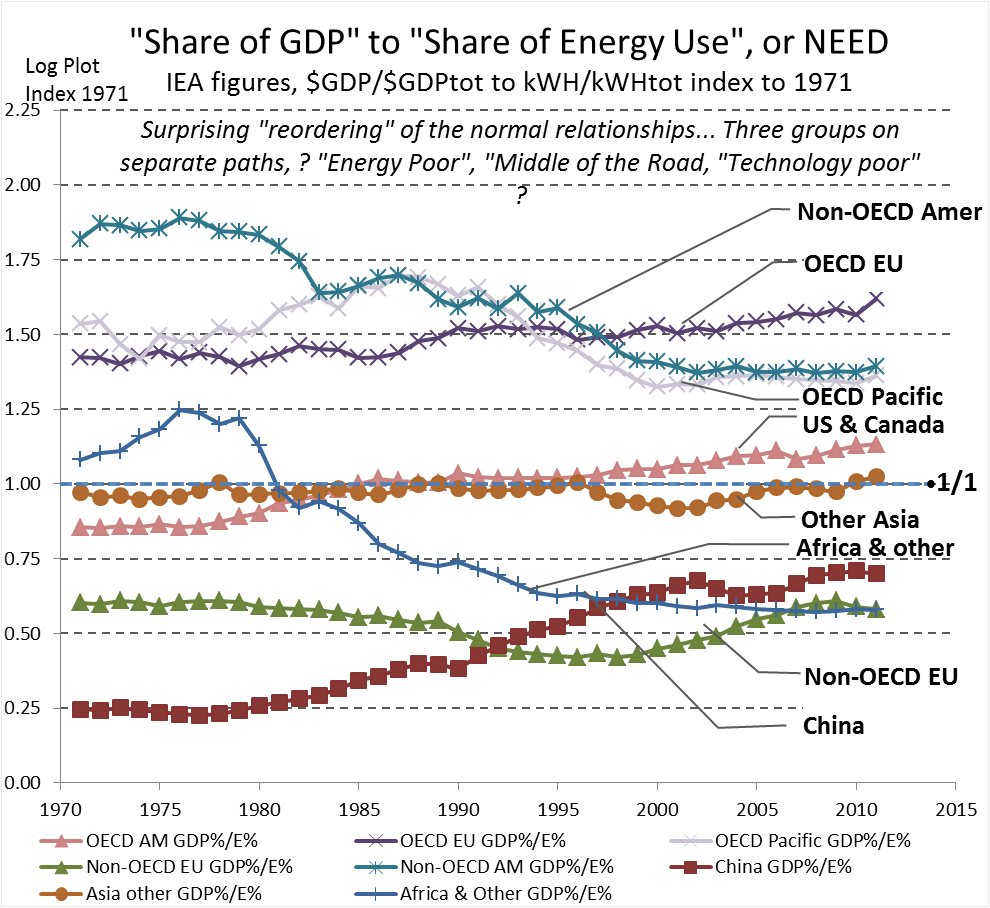
There’s been a long debate and mystery caused by economic accounting for the world’s energy use not being able to trace the trade in economic energy services, the amount of China’s energy embedded in our TV’s and the amount of of France’s energy embedded in Soviet block heavy industry… etc.
A country’s Share of the World’s GDP per Share of World Energy, measures
“Relative Economic Energy Dependence” ‘NEED’
a strong indicator of how much of its economy is fed by off-shore, mostly ‘fossil’, energy services, most oftennot being counted in national energy accounts. Countries do have different energy productivities, but World competition actively selects competitive energy uses wherever they are found. So like waves on a pond… the national accounts vary in relation to each other, and the global accounts are smooth and reflect the gradual changes of the system as a whole.
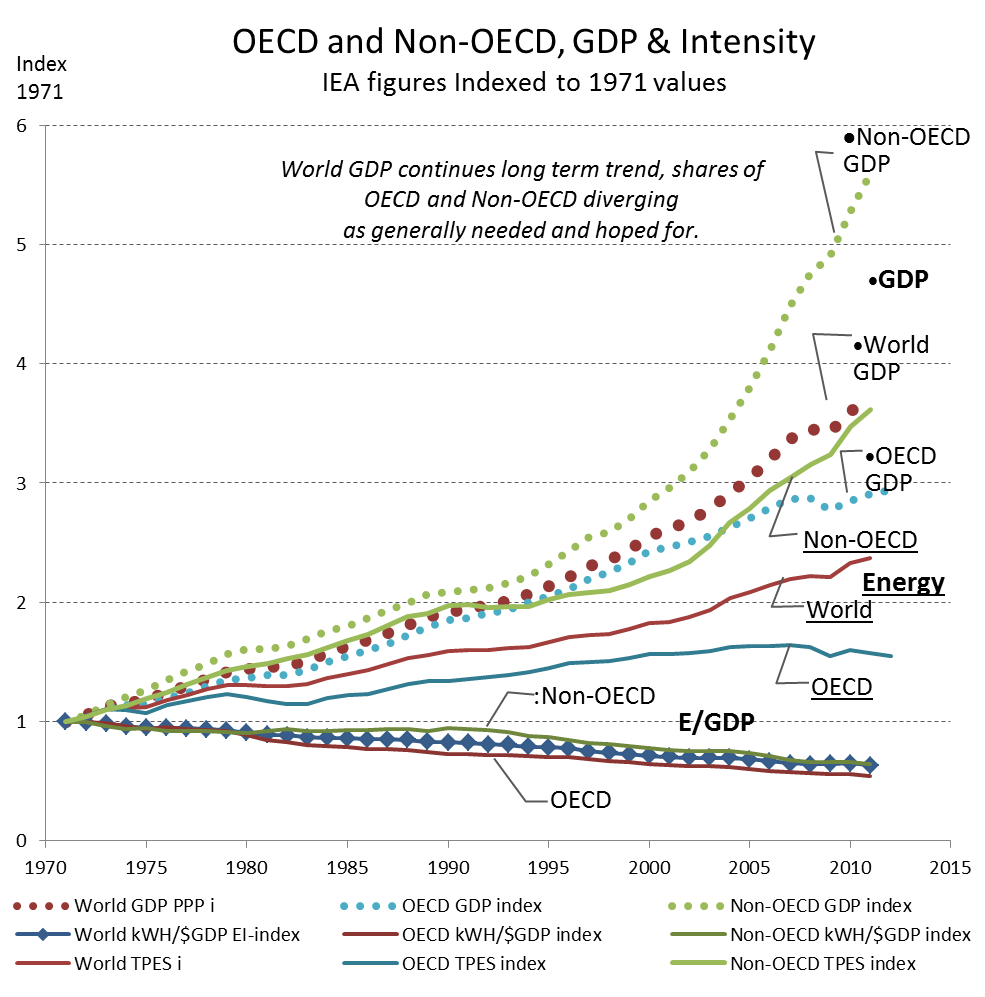
A. – World averages compared to OECD and Non-OECD performance
We see in Figure A strong diverging trends in GDP and Energy use for OECD and Non-OECD groups, along with converging steady trends for the ratio Energy/$GDP, over the past 40 years.
As the less developed remain smaller, but grow faster, the more developed are giving them development space.
The Energy/$GDP (intensity) is continuing it’s long historic path of quite steadily decline, NOT diverging, showing how smoothly the interlocked productivities of the world economy “level the playing field” for energy services, delivered to where they are most valued..
B. – The developed countries with less energy supply import energy services from others with more
Figure B shows the NEED of the major 8 World Sectors shows much more variation, and you can see some of he fitting shapes that cause the total to be a straight line.
The US & Canada are close to the 1/1 average, but steadily rising
The EU, Japan and Australia are ~1.5/1 rather dependent on Off-Shore energy services, lacking abundant sources.
So the ridh “Energy Poor” economies need to purchase more and more of their energy in the form of energy services from their neighbors, as “how economies work”.
It causes a likely mistaken impression the EU is more “sustainable”, greatly outperforming the US & Canada.
National Energy Accounts don’t trace trade in energy services, only trade in energy materials, needing a “Shares of GDP” proxy measure as here to find it.
The National Energy Accounts are not set up to trace trade in energy services, only in materials, requiring a “Shares of GDP” proxy measure to find it.
It shows a very good reason why we all need to learn, as in Scope-4 impact accounting for the World SDG, the use of GDP as a proxy measure of average economic energy use, and also why it works so well. The “global economy” and it’s highly competitive use of world information on the most profitable uses of energy. It makes energy use a universal “currency” naturally, as a useful measure of GDP for many purposes, and the use of GDP as a proxy for energy use and environmental “externalities” resulting from our obtaining and using energy to alter the earth for our purposes.
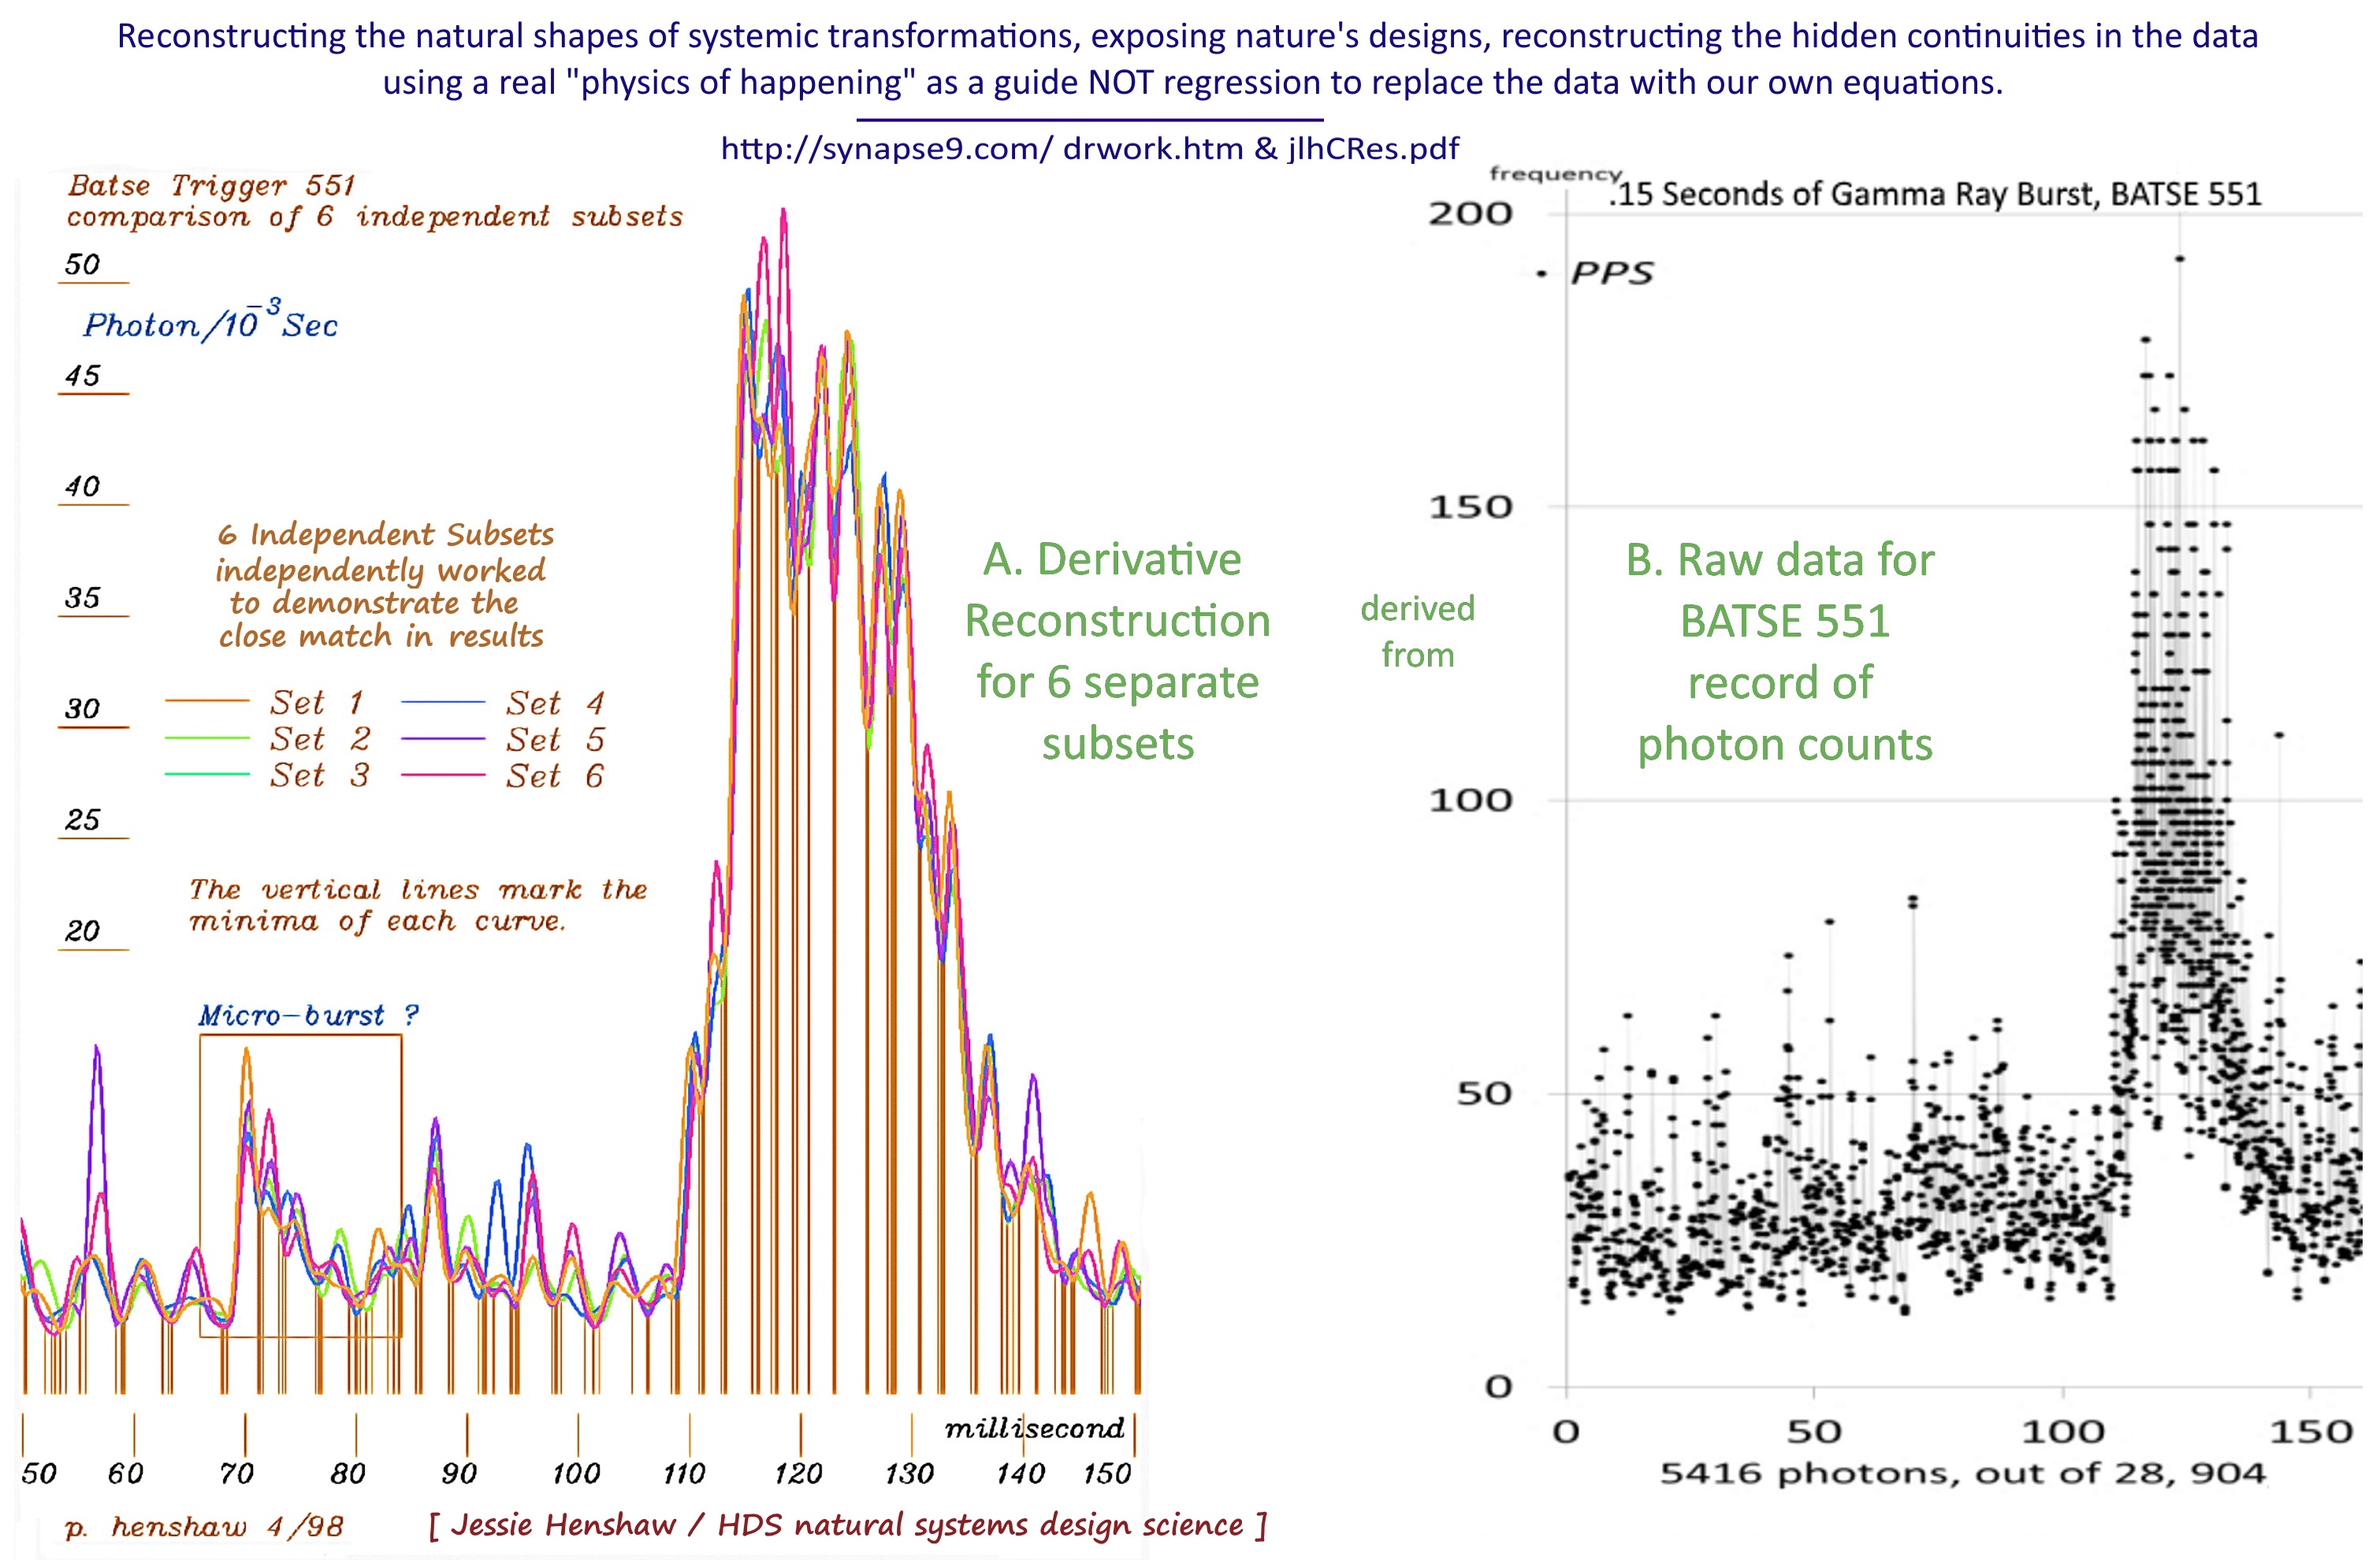
Gamma ray bursts are the most high energy events commonly observed in the universe, associated with the formation of “black holes”, and creating very high energy x-rays. NASA provides good introductory information with a nice animation. Satellite instruments easily record the time and intensity of these events but can only rarely connect them a location. So they’re one of the more mysterious of cosmic events, also common and occurring a few a week.
The 1998 gamma ray burst study was of the data from NASA you see in the figure below, called “BATSE Trigger #551”, using the 6494 points recording gamma rays in Energy Levels 3 & 4, chosen for being less noisy. The object is to reveal the detailed shape of any underlying continuous processes involved, as seen in the second figure. To date, it seems, gamma ray bursts like this are only understood as statistical events, like “bursts of noise”, instead of as dynamic events with continuous processes .
BATSE Gamma Ray Burst Trigger #551. Energy Levels 3 & 4
You can see below the clear dynamics of the first of the three major burst events in the record, consisting of a sudden rise without evident developmental processes, followed by an abrupt shift to declining by a regular “S” curve progression, of the decline first speeding up and then slowing down. That connection of two highly differing dynamics is something like the “bursting of a bubble”, with the breach of the containment and the release of the pressure having very differing dynamics. That analogy may not apply to black holes, of course, but understanding two different dynamics is likely important to understanding what is physically occurring.
Overlay of the Six Subsets of the data, with the 3rd derivatives regulated to expose the implied continuities the same way
The other highly noticeable shape exposed is an apparently fairly regular 3 millisecond fluctuation in the cosmic gamma ray background. As to whether is a feature of the data or of the analysis, one can see it is bothquite regular and irregular enough. The regularized curves are shown in six colors, each one representing the same derivative regularization applied to a different subset containing concurrent 1/6th’s of the whole data. The vertical lines mark minima for every fluctuation in each of the regularized subsets. Continue reading Gamma Ray Bursts – dynamics reconstructed→
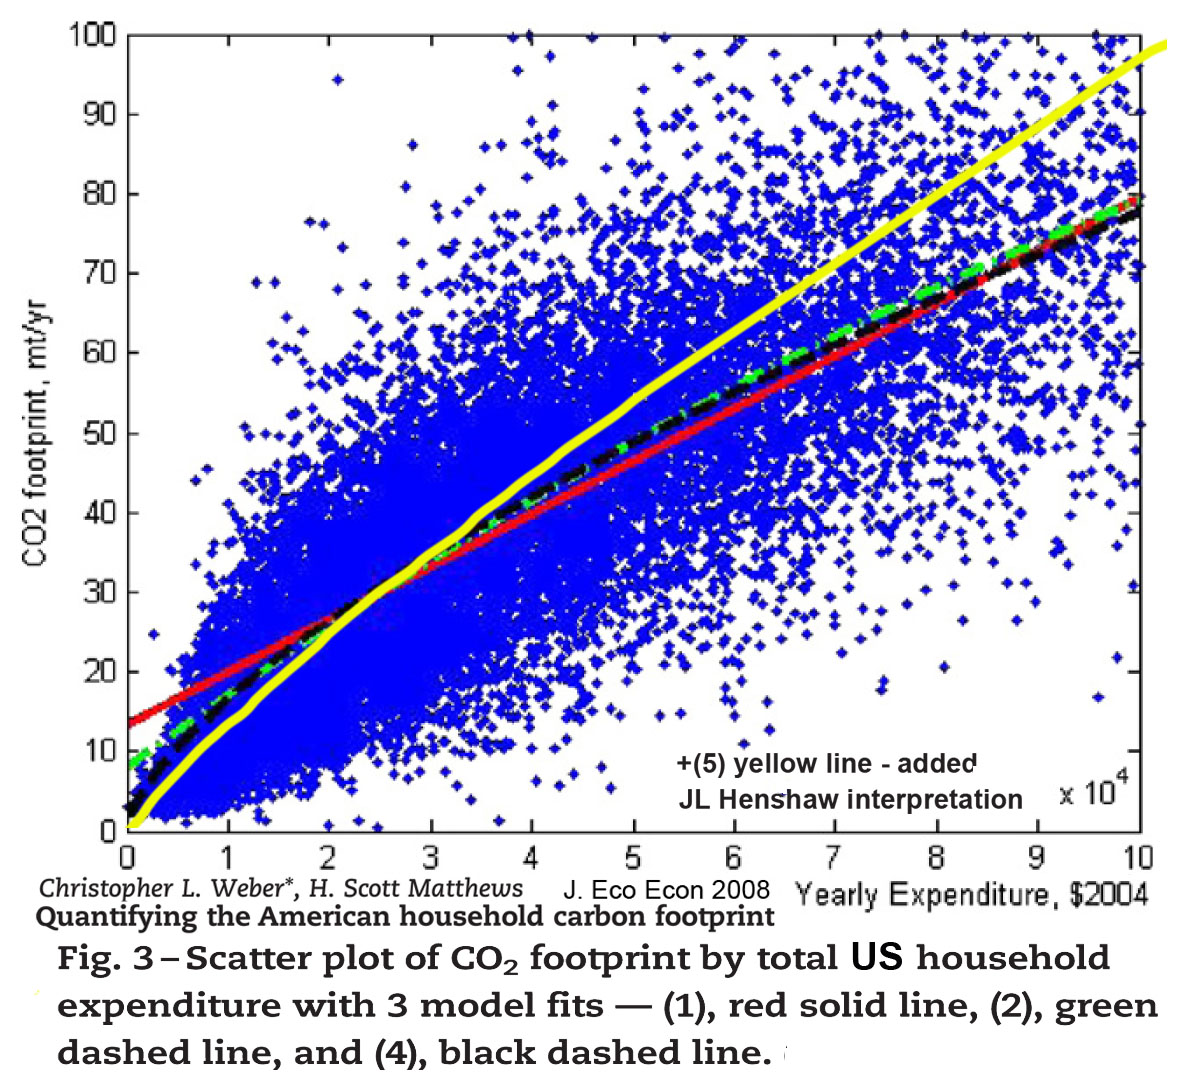
A “telling” image… connecting dots: the distribution of US household CO2 footprints, by income level from Weber and Mathews 2008
The average Co2 intensity is shown as ~1.0 kg CO2/$1 of income (the scales go to 100 tonne/yr CO2 and $100,000/yr income). That’s about twice the world average CO2 intensity, which was closer to = ~ 0.45 kg/$ GDP in 2004, (declining at 1.24%/yr historically). What it does nicely is confirm one of my most contentious conclusions from the Systems Energy Assessment (SEA) paper and so called “scope-4” assessment. It shows what it means to use average spending, like household “wages” as a baseline measure of average economic consumption impacts. Because the slope of the curve is so different from what I expected I think it remains to be confirmed. The US consumption intensity seems to be about double the world average. It doesn’t seem right but I don’t know what would cause that.
My interpretation of the trend is the yellow curve, just from the overall torpedo shape. A large poor population could be distorting the regression curves.
In any case, none of these household impacts being funded by businesses are being counted as impacts of operating businesses by the widely used sustainability metrics! That disclaimer of responsibility seems mostly to be for historical reasons, though, and for the simplicity of accounting for information coming from different places. It also shields business sustainability decisions from having to deal with quite the whole problem at first. Sustainability decisions will later be found to need to deal with it, of course, appearing now to start with a limited task, like a start-up problem, a bike with training wheels.
For the 2010 & 2011 SEA studies of a typical wind farm business plan, we tested what would happen if we were to include this discounted part of the business footprint as having a “world average” CO2/$ intensity. Our including it increased the total measure of energy and CO2 impacts for the business by 400%, as human services actually proved to dominate this seemingly technology centered business. With this new information on the US household impact distribution, I’d now need to say US businesses might actually have footprints 800% larger than presently being counted.
It seems we’re in the middle of quite some learning process! ;-)
This exploration of a pivotal world issue, on which the success or grand failure of our present global development strategy rests… is an example of the wide range of penetrating treatments of important topics covered in the Research Journal “Reading Nature’s Signals“. It document’s Jessie Henshaw’s current application of the the natural systems identification and organizational exploration methods that originated with a discovery in the 1970’s of how transitions in the continuity of natural processes expose the design of the systems and how they are changing, introduced in: The Physics of Continuity = ladders of change
We have a responsibility to use both the words of science and also the methods, when choosing methods of “Sustainable Development” to rely on for our effort to save the earth. It’s often not easy to do. Ask any scientist. It’s often as hard as sitting down to write a great poem, a different kind of creativity but just as demanding. This article discusses the correct scientific method for defining measures of “decoupling” our growing economy from its growing impacts on the earth.
That’s the part of the “Decoupling Puzzle” I can actually answer, offering a way to scientifically define an SDG for Post 2015 “economic decoupling”, and the measure of compliance. See also to the PDF file and XLS file to see the details of the model. It’s a bit different from the approach shown in the UNEP report on decoupling . What I define is an evidence based scientific measure of a growth economy departing form its reliance on growing resource use. It could be used in regulating the economy’s approach of our best understanding of the natural limits of sustainable development:
“A world Decoupling Rate that would assure, within planetary boundaries, adequate development space and “carrying capacity” to fulfill the intent of the SDG’s.”
How to transform the economy to create growing wealth without growing resource use is left to the reader or other discussions, though I give a hint to what that “entirely new kind of wealth” might be at the end.
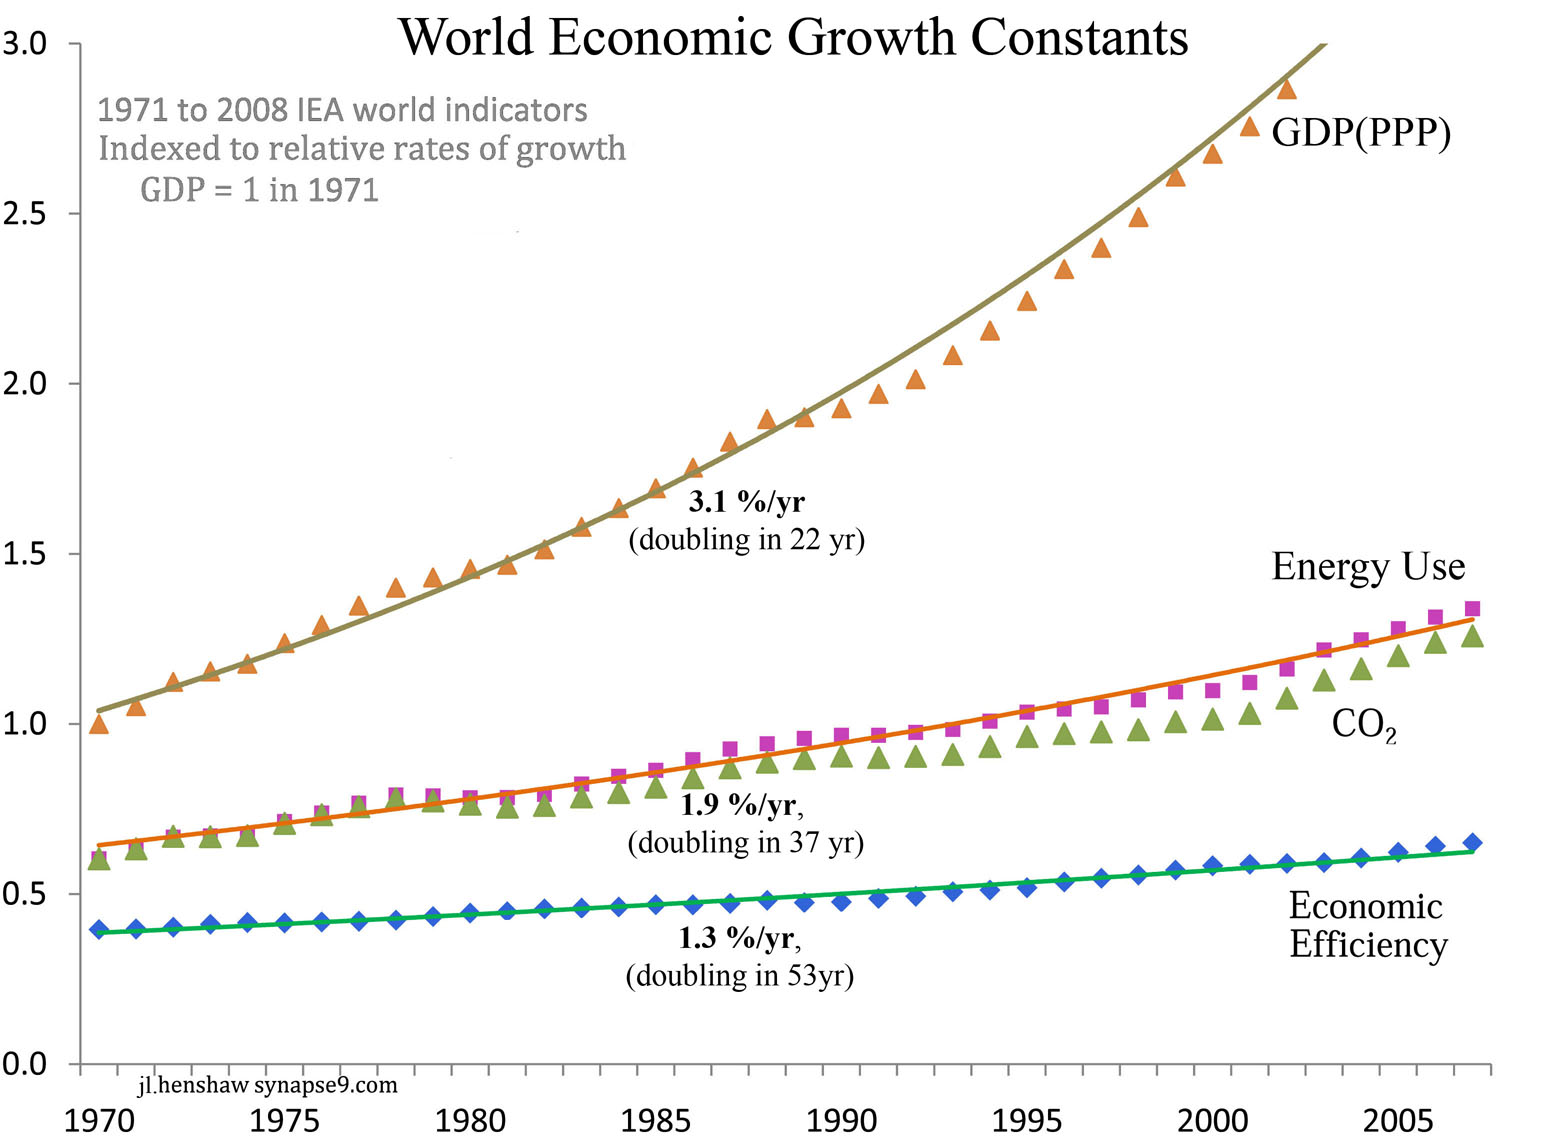
We start with the historic records that display the past “growth constants“ of the world economy. Figure 1. shows GDP, Energy use, CO2 and the GDP energy efficiency of the economy all growing together, with growth rates that are in constant relation to one another. That is the “coupling” of GDP and resource use that needs to be “decoupled”.
That evident constant growth rates and their proportionality (i.e. the “coupling”) is called “natural” because throughout history people have noticed it, tried to explain it, and also tried to change it, all to no avail. This coupling of these measures of the whole economy has continued as if measures of a growing person’s “height and weight”, growing at different rates, but still growing together. It has seemed to be just how the economy works.
As a systems ecologist, myself, I see them as displaying humanity’s natural rate of whole system learning, limited by coordinating all parts of human innovation and development efforts, while struggling to expand at the fastest accelerating rate possible. Systems ecology, then, does not consider economic growth as a “monetary progression” but as an “organizational progression”, a process of “whole society” building on its past to create a new future. This historical record is “how we’ve been doing it” so far, and now that we’ve found it unsustainable we need to change to something different.
…”growth” is a process of our learning how to coordinate doing what we want.
Fig 1. The historical coupling of GDP growth, in constant relation to Energy, CO2 and Energy Efficiency Growth
To measure a departure from that we start with the “Economic Growth Constants”:
GDP (3.13 %/yr), Energy use (1.89 %/yr), and Energy Efficiency (1.24 %/yr) . The linkage between the GDP and Energy curves, is the “EnergyCoupling Rate” (60.4 %/yr the ratio 1.89/3.13), how fast energy use grows relative to wealth.
The idea and fallacy of “Decoupling”
is to weaken that linkage between earth and economy to zero, changing what has long been a constant coupling rate of 60% by successive reductions to 0.0%, just by continuing to dramatically improve the efficiency of resources use as before. Many people believe new technologies should revolutionize development to do that, other’s think innovation will create products people prefer that just don’t consume energy to produce or to use. What both would agree is that 60% needs to decline toward 0.0%
We could define that transition as a “Decoupling Rate”, the rate at which the Coupling Constant of the past declines toward ‘0.0’. That would allow continued growth in wealth without adding to what we now see are globally unsustainable scales of energy use impacts on the earth. Defined for energy use alone would serve to define it not just for the impacts of fuel extraction and consumption, but also ALL the impacts of a material kind we cause by using the energy we extract for creating economic products.
So.. that would be generally inclusive of all economic impacts
that needed energy to be produced.
Scope-4 impact measures add up the total environmental inputs resulting from business, personal, or policy choices. That’s so we can compare different choices, and make the better one. Sounds like what sustainability metrics should do!
Standard sustainability metrics, however, collect impact information by where they occur,
not by what choices cause them…
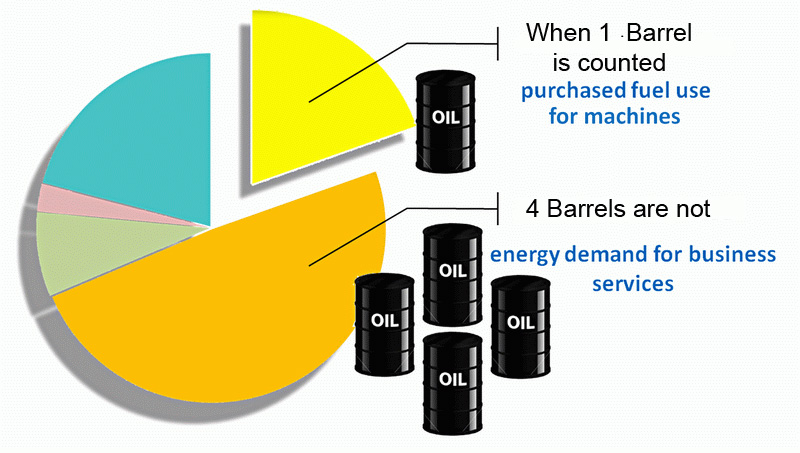
So our whole metric system needs to be rethought. Today if a business decision involves employing six new machines and six new people, all that is counted are the impacts of the machines. The impacts of hiring the people or paying the investors or the government… aren’t counted. Nature sees all the kinds of impacts incurred by business decisions exactly the same way, though! It was our accounting community, going back centuries it actually seems, that decided to count one and not the other.
The omitted impacts are actually not hard to scientifically estimate for scale. That’s what Scope-4 accounting does. As you work with it you find more and more ways having the numbers right results in big changes the terms of discussion. The core scientific issue then, is having a metric that does not associate environmental impacts of business with the choices that cause them, but with the locations where the information is collected. That inconsistency may be as fundamental to economic accounting as to have originated in how business records were kept in ancient times on clay tablets.
The [ e = mc^2 ] LAW OF SUSTAINABILITY
ln(e) / ln($) = c
It says our growing earth impacts and growing earth economy are directly coupled.
The natural constant observed, [c], is the coupling of GDP and Energy use, as a measure of everything physical the economy does. It’s expressed as a ratio of their growth rates (here as a ratio of their natural logs). That coupling has been a constant [0.6] for a long time. You see it clearly in the figure below, showing a 40 year official world record for the economy’s growing Energy use and GDP.
It says that our increasing use of energy for altering the planet to make money grows only a little slower than GDP, at 0.6 times the growth rate of GDP, AND that this direct coupling has not shown any tendency to change over time! People imagine that ‘efficiency’ changes the coupling, but even with growing efficiency the ratio has actually quite constant. You’d need global efficiency in energy use to double every ~20 years like GDP generally has to really make a difference, so having growing value in a steady GDP is far more possible.
Of course, like e=mc^2, it’s not possible to tell quite where the natural constant observed comes from. That’s a big part of the scientific interest. Natural constants are emergent properties of the system, seemingly here a natural rate of societal innovation and adaptation, like a “natural learning speed”. The benefit of the constant is giving us a better way to measure inclusive sustainability, using the mathematical implication that:
— average shares of GDP pay for and are responsible for causing
average shares of GDP earth impacts —
The world economy grows as a whole, nob acting at all like the parts…
The power of this rule the direct coupling between responsibility for shares of Earth Impacts and shares of Earth GDP. It’s a measure that combines all the impacts of extracting energy and all the impacts caused by using energy, i.e. everything the economy does, with financial earnings from the economy. When the data is aggregated correctly, it allows a complete accounting of the GDP impacts, and “closed accounting” for shares of responsibility for them. So that for whole supply chains, one can measure their share of exhausting all our resources, forest and species loss, paving over productive land, etc. Delivering goods for an average dollar of GDP causes an average share of the whole economy’s impacts.
.
Scope 4 CO2 assessment
The science for applying this constant natural coupling of money and GDP impacts was published in 2011 in a research paper “Systems Energy Assessment” found at the SEA resource site. More detailed research notes are in the article What’s “Scope 4″. The physics is sufficiently general and inclusive that the same technique can be comfortably use globally, to assign responsibility for all impacts of GDP on the earth, and have a way to “internalize all externalities” that can start and remain valid as it is incrementally improved, as in “A World SDG“.
The SEA research study pie chart, 5 time the true impact causation found compared with standard method.
Discussion:
The real tragedy is that this bias in our business impact metrics assigns TOTAL responsibility for environmental impacts to the people who are paid to do them, who would not do them unless they were requested and paid for by someone else.
So then ZERO responsibility is assigned to the people choosing to request and pay for the impacts, communicating their requests for them by the transfer of money.
In criminal law, as when paying to have a crime committed, requesting and paying for it is considered the principle direct cause of the crime. The person paid to do it may be penalized equally or not. As far as physically causing economic externalities, in the court of environmental responsibility, it really should be decided the same sophisticated way.
What Scope-4 accounting does, then, is start from the complete list of things a decision pays for. It could become a tremendously long list, with lots of things only known from the money spent rather than from exactly how the service was provided. So for those you need to do research on what default assumption to make in case in case more detailed information does not become available. I’m still waiting for people to study it themselves and compare results, but I think the proof is completely convincing that absent other information the necessary default assumption is not “zero” but “average”.
Elementary technique:
If you get stuck in deciding what to count, just remember, businesses don’t pay for things except for business reasons, so you need to count *everything*.
You then think about the different categories of spending, and what their “direct” (material) and “indirect” (economic demand) impacts are.
The initial rough estimate rule for economic impacts is to count them at 90% of the world average per $GDP, like around 7000BTU/$.
Make sure you use inflation adjusted $’s and state the index year.
That’s easy to do, and lets you reserve your time for estimating the direct impacts, according to the added information you can collect.
So for the energy content of purchased fuels, for example, you’d count BOTH the direct energy content of the fuel, AND the economic energy impact of the spending, at 90% the world average. The reason is that the fuels come from nature, and the spending goes to people, paying them for the consumption they do to bring you the fuel.
If done correctly, the bottom line is a unique pie slice share of the world’s impacts
for delivering your share of GDP.
Another one to think through is how to estimate the impacts of retained earnings, used for either financial or business expansion investment. The economic impacts of that spending needs to be estimated with a multiplier over time… The whole purpose is to truthfully estimate the types and scale of consequences for our economic decisions.
More discussions can be found searching the journal or the web for “Scope-4” or “SEA-LCA” as interchangeable names for the same group of accounting methods.