
Here’s the whole problem:
Scope-4 impact measures add up the total environmental inputs resulting from business, personal, or policy choices. That’s so we can compare different choices, and make the better one. Sounds like what sustainability metrics should do!
Standard sustainability metrics, however, collect impact information by where they occur,
not by what choices cause them…
So our whole metric system needs to be rethought. Today if a business decision involves employing six new machines and six new people, all that is counted are the impacts of the machines. The impacts of hiring the people or paying the investors or the government… aren’t counted. Nature sees all the kinds of impacts incurred by business decisions exactly the same way, though! It was our accounting community, going back centuries it actually seems, that decided to count one and not the other.
The omitted impacts are actually not hard to scientifically estimate for scale. That’s what Scope-4 accounting does. As you work with it you find more and more ways having the numbers right results in big changes the terms of discussion. The core scientific issue then, is having a metric that does not associate environmental impacts of business with the choices that cause them, but with the locations where the information is collected. That inconsistency may be as fundamental to economic accounting as to have originated in how business records were kept in ancient times on clay tablets.
The [ e = mc^2 ] LAW OF SUSTAINABILITY
ln(e) / ln($) = c
It says our growing earth impacts and growing earth economy are directly coupled.
The natural constant observed, [c], is the coupling of GDP and Energy use, as a measure of everything physical the economy does. It’s expressed as a ratio of their growth rates (here as a ratio of their natural logs). That coupling has been a constant [0.6] for a long time. You see it clearly in the figure below, showing a 40 year official world record for the economy’s growing Energy use and GDP.
It says that our increasing use of energy for altering the planet to make money grows only a little slower than GDP, at 0.6 times the growth rate of GDP, AND that this direct coupling has not shown any tendency to change over time! People imagine that ‘efficiency’ changes the coupling, but even with growing efficiency the ratio has actually quite constant. You’d need global efficiency in energy use to double every ~20 years like GDP generally has to really make a difference, so having growing value in a steady GDP is far more possible.
Of course, like e=mc^2, it’s not possible to tell quite where the natural constant observed comes from. That’s a big part of the scientific interest. Natural constants are emergent properties of the system, seemingly here a natural rate of societal innovation and adaptation, like a “natural learning speed”. The benefit of the constant is giving us a better way to measure inclusive sustainability, using the mathematical implication that:
— average shares of GDP pay for and are responsible for causing
average shares of GDP earth impacts —

The power of this rule the direct coupling between responsibility for shares of Earth Impacts and shares of Earth GDP. It’s a measure that combines all the impacts of extracting energy and all the impacts caused by using energy, i.e. everything the economy does, with financial earnings from the economy. When the data is aggregated correctly, it allows a complete accounting of the GDP impacts, and “closed accounting” for shares of responsibility for them. So that for whole supply chains, one can measure their share of exhausting all our resources, forest and species loss, paving over productive land, etc. Delivering goods for an average dollar of GDP causes an average share of the whole economy’s impacts.
.
Scope 4 CO2 assessment
The science for applying this constant natural coupling of money and GDP impacts was published in 2011 in a research paper “Systems Energy Assessment” found at the SEA resource site. More detailed research notes are in the article What’s “Scope 4″. The physics is sufficiently general and inclusive that the same technique can be comfortably use globally, to assign responsibility for all impacts of GDP on the earth, and have a way to “internalize all externalities” that can start and remain valid as it is incrementally improved, as in “A World SDG“.
Discussion:
The real tragedy is that this bias in our business impact metrics assigns TOTAL responsibility for environmental impacts to the people who are paid to do them, who would not do them unless they were requested and paid for by someone else.
So then ZERO responsibility is assigned to the people choosing to request and pay for the impacts, communicating their requests for them by the transfer of money.
In criminal law, as when paying to have a crime committed, requesting and paying for it is considered the principle direct cause of the crime. The person paid to do it may be penalized equally or not. As far as physically causing economic externalities, in the court of environmental responsibility, it really should be decided the same sophisticated way.
What Scope-4 accounting does, then, is start from the complete list of things a decision pays for. It could become a tremendously long list, with lots of things only known from the money spent rather than from exactly how the service was provided. So for those you need to do research on what default assumption to make in case in case more detailed information does not become available. I’m still waiting for people to study it themselves and compare results, but I think the proof is completely convincing that absent other information the necessary default assumption is not “zero” but “average”.
Elementary technique:
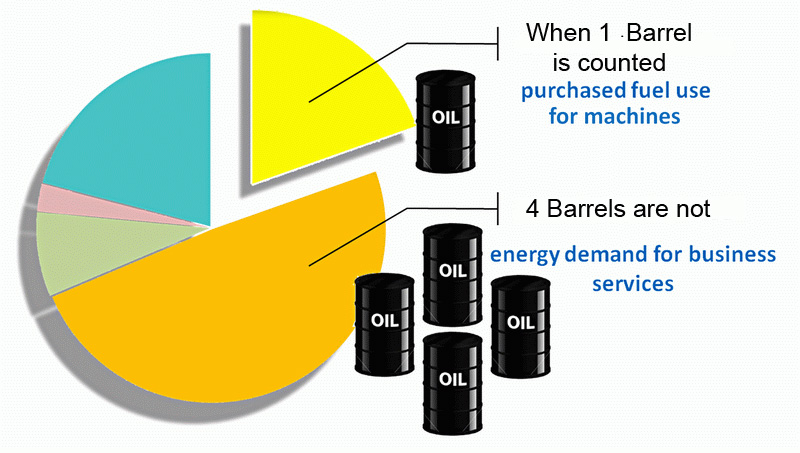
- If you get stuck in deciding what to count, just remember, businesses don’t pay for things except for business reasons, so you need to count *everything*.
- You then think about the different categories of spending, and what their “direct” (material) and “indirect” (economic demand) impacts are.
- The initial rough estimate rule for economic impacts is to count them at 90% of the world average per $GDP, like around 7000BTU/$.
- Make sure you use inflation adjusted $’s and state the index year.
- That’s easy to do, and lets you reserve your time for estimating the direct impacts, according to the added information you can collect.
So for the energy content of purchased fuels, for example, you’d count BOTH the direct energy content of the fuel, AND the economic energy impact of the spending, at 90% the world average. The reason is that the fuels come from nature, and the spending goes to people, paying them for the consumption they do to bring you the fuel.
If done correctly, the bottom line is a unique pie slice share of the world’s impacts
for delivering your share of GDP.
Another one to think through is how to estimate the impacts of retained earnings, used for either financial or business expansion investment. The economic impacts of that spending needs to be estimated with a multiplier over time… The whole purpose is to truthfully estimate the types and scale of consequences for our economic decisions.
More discussions can be found searching the journal or the web for “Scope-4” or “SEA-LCA” as interchangeable names for the same group of accounting methods.
jlh 11/8/14
_______________
A letter on the subject that might be of interest to some…
to the UNEP FI / WRI GHG Financial Risk Guidance working group…
…. the difference from I/O LCA models
The main difference is that SEA-LCA counts in a business’s own impacts the consumption that people are paid with for the human services that business uses to operate, and I/O LCA doesn’t. I/O LCA counts them, but as impacts of other businesses and sectors, not of the businesses paying for the services… What we found letting us measure it statistically was that consumption for human services was mostly in consumer products not producer products.
So SEA-LCA v.1 treats human consumption impacts as “misplaced information” and corrects business impacts by just counting the impacts of the human services which that business uses in its own environmental impacts (not another’s). To make that manageable we estimated human services impacts only for scale, and generally implying large adjustments in individual business energy use and financial GHG risk exposures. That was done using impact intensity factors for business costs for known or implied human services. For the SEA Wind Farm study, I roughly estimated that 90% of the energy used to deliver the consumption for human services needs would come from sectors other than those for the wind farm’s producer products.
I think you’re helping me get to what’s relevant here. I hope so anyway.
All the very best, Jessie
More detail fyi….
So, I know of nothing wrong with the I/O accounting (for measuring material exchanges between economic sectors). The problem is the definitional exclusion of environmental impacts of human services, throughout the business value chains. Below are a “value tree” diagram and a comparison table to help, and bring out more issues for further research. In the diagram the human services are symbolized by green dots, the money from business revenues going to people, versus other businesses along the tree.
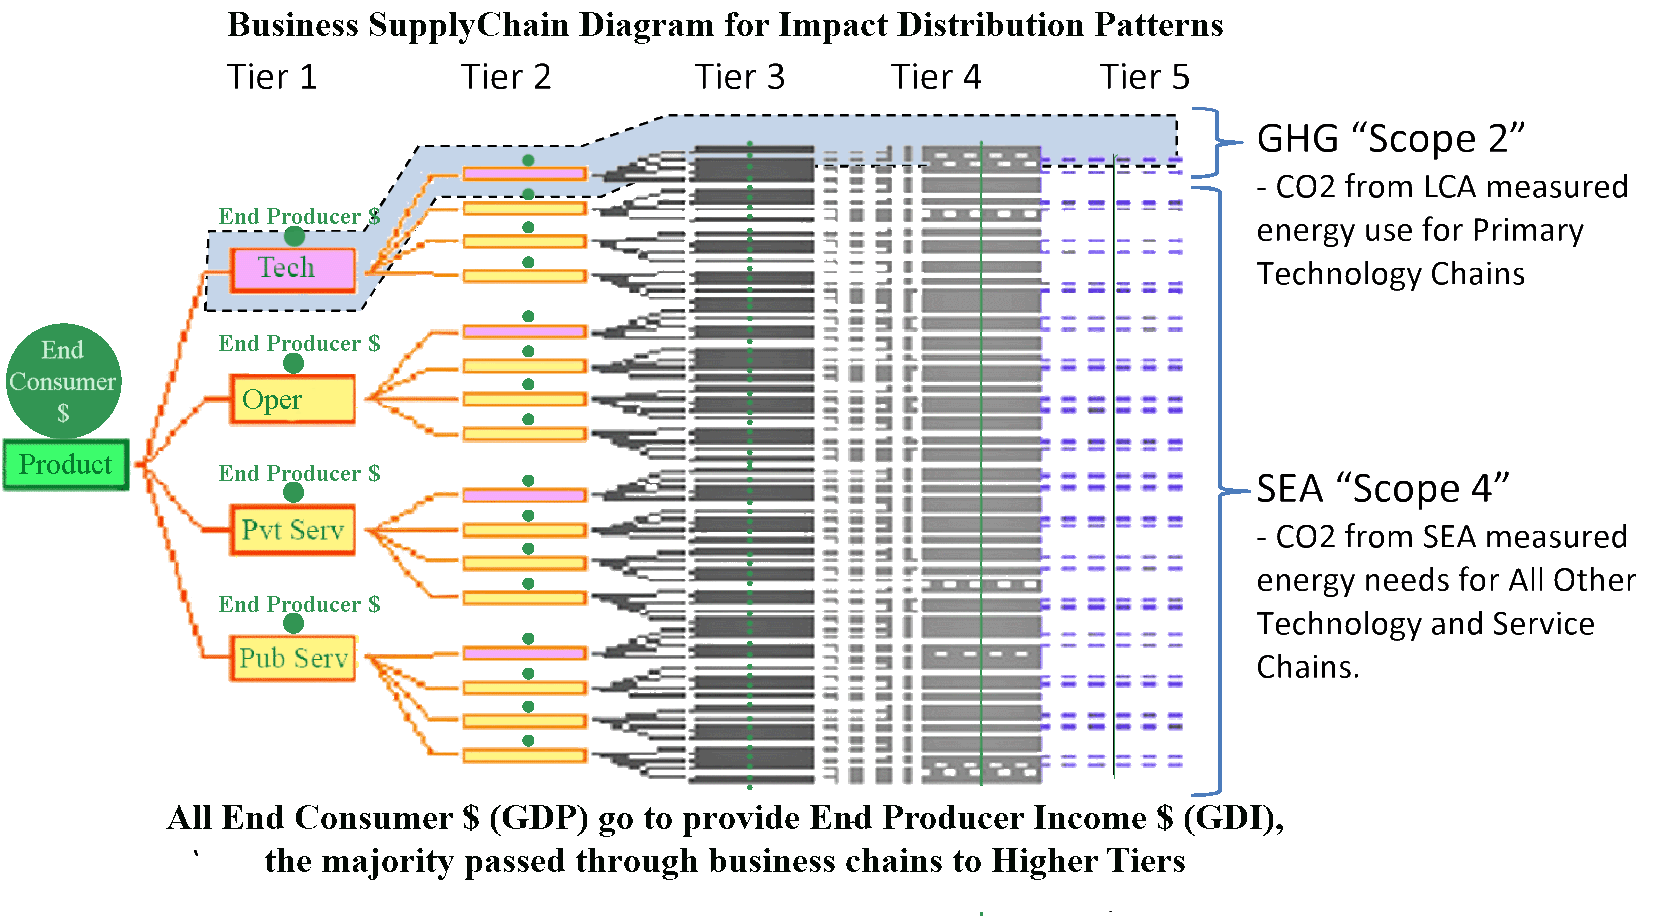 |
| Green dots are for the people paid to operate businesses, throughout the business “value tree” . (in I/O accounting having no role in businesses except as consumers) |
For impact accounting you need to add up all producer inputs in an individual business value tree. It seems to be the same as for cost accounting. If your cost accountant arbitrarily removes what you spend on taxes and stockholder distributions it seems to improve the balance sheet, but how you price your products might be too low. The value trees produced by I/O transfers are of average transfers between sectors, not an individual business case, and locate the impacts for employee consumption in different sectors than the business, so the impacts of the individual business as a whole can’t be accounted for. You need an individualized business impact assessment to respond to its individual financial risk exposures. As the individual tree actually has billions of different inputs, it would be uneconomic to individually account for them though. So there’s a trade-off between getting the scale right and getting the answer precise.
SEA is designed to statistically fill in missing information statistically, so the end user consumption paid for by a business are shown as impacts of the business. The accuracy for scale depends on whether the total of assessed impacts for components of GDP turn out to be equal to the total impacts of the economy. Once a business’s total assessed impacts match its share of the total for GDP, then you can be more confident about the relative importance of the value chain parts. The performance of different parts of the value chain might matter for how businesses respond to a GHG tax.
A GHG tax could charge a fee to either by 1) businesses, 2) consumers, 3) investors or 4) fuel suppliers, or different fees for each. In any case, normal financial risk to investors would come from increasing costs in every part of the value tree for their investments, raising prices for business consumers and lowering consumer demand. With SEA, the accounting increase for starting to count the use of human services and paying for that end user consumption as a cost of production and business impact, would be very widely distributed. If the direct tax exposure for a GHG tax on business would be first for their total accumulative embedded GHG’s, to be reduced by the GHG tax already paid or discounted by others in the value tree.
How SEA statistically fills in missing environmental impacts is by assigning an intensity factor (Eii) for business costs with untraced impacts. For the SEA paper 90% of average Energy/$GDP was used for employee and general business expense costs. (It was an estimate of the probable spending on consumer products drawing on I/O sectors not included in their business sector’s producer products.) Why consumers might by products mostly from other sectors than they work in is simple. Employees of a steel plant mostly don’t by steel producer products when they shop. They go to Walmart, pay their mortgage, drive their cars, educate their kids… etc.
Those are direct “consumption for production” costs to the business that pays them for bringing their talent, organization skills or ownership rights to the operation of the business. They’re also direct environmental impacts not being counted by either process or I/O LCA methods. The Eii = 90% is such a general guess, that’s one of the first things others would need to validate by making their own estimates. Perhaps the modern I/O models have improved, so the general estimate might be %60 rather than %90. Perhaps they have data determining intensity factors for missing inputs for every sector already. My assessment seem mainly definitive, though, on human services being business costs that have environmental impacts being left out of the economic analysis. What I’d like the people who did the basic science for the Carnegie Mellon I/O method, or someone recommended by them, to take on the problem as an interesting challenge and begin the research needed to make financially reliable “whole system assessment” generally available.
_________
The table may not be hugely useful, as it may take careful study and no say any more than the conceptual descriptions above, but it records the approach I took last night to comparing the outputs of the two methods
|
I/O-LCA method by Carnegie Mellon v. SEA-LCA method by Jessie Henshaw et all. |
|
Business cost sector |
2002 Energy/$ of sales * |
note |
|
|
SEA-LCA kWH/$ |
I/O-LCA kWH/$ |
||
|
World Economy |
2.76 * |
2.76 * |
*IEA World statistics – adj. to 2002 values from 2006 values |
|
“human services” intensity (for operating, organizing or owning businesses |
Est. 90% of avg. |
(undefined) |
I/O-LCA does not count human service impacts as business costs. SEA-LCA v.1 – ** counts human services at 90% of GDP impact intensity, as if 90% of consumer impacts are in economic sectors other than that of the business they are employed by. |
|
Model Wind Farm |
Energy |
Energy supplied & Total Energy costs, per $ sales |
|
|
Power generation and supply |
Energy |
Energy supplied & I/O-LCA Energy costs, per $ sales |
|
|
Non res. commercial construction |
8.34 |
more accurate if increased by 2.48? ** |
|
|
Elementary and secondary schools |
1.71 |
more accurate if increased by 2.48? ** |
|
|
Management consulting services |
5.54 |
more accurate if increased by 2.48? ** |
|
JLH 4/5/14