Yes, quite nice work. I think learning how natural systems develop and change as wholes seems needed too, though. We are often easily confused by how easy it can sometimes be to change the parts of systems we want to change as a whole. Systems generally develop as wholes and change as wholes, though, of course, unless broken up. Learning how to foster whole system change often comes from attempting to engineer some living system, to then see it fail over and over, learning how from experience by deep emersion in the context to understand its needs. That’s often how businesses evolve, by the deep emersion of its people in creating order from the chaos their first attempts cause. That’s still likely to happen, but might be made easier if people studied how actual systems emerge and change.
Real system change is more like the birth of a child, something developing as a whole and emerging as a whole, to then find it has to actively explore and adapt to find its place in the world. That applies to the birth of new ideas for new kinds of organization within a business, for or in a community, or in the world. It always first starts with the germination of its growth, then development and maturation on the way to having a life. Each stage is a unique challenge and experiential learning and growth process. The first creates its insides and then develops its relationships outside, to fit with the environment it emerges into.
What we’re struggling with globally is, of course, moving the world system in a profound and dramatic way. Though it is very different from learning to personally host and guide the birth of innovations in our work to fit their contexts there is a lot about global change we can learn from it. For a global change, we need to recognize first that we are not in control of much at all. Secondly, we need to recognize that systems are systems primarily because they are self-controlled, work as wholes, and though they have flexible parts and do often change by themselves, they really ONLY change as wholes and not by pushes and shoves, but by themselves something like we do.
That’s where it’s useful to study our experience with systems that change by themselves, our groups, friends, communities, selves, and children are things we know a lot about. There are only a few ways an outside approach can help, or hinder. For systems that one is part of one can spread the feeling of the pressures and any useful knowledge of opportunities for a whole to change on its own. There are often places where a developing whole system awareness is not getting through, and different forms of whole system awareness are needed. That is what seems to prepare a system for some sort of inspiration of its own, sometimes called “animal spirits,” that trigger whole system change, in a direction that motivates the whole.
We see it in our own behavior, as with what makes us overcome habits and do something new. It takes deep and ultimately inspiring feelings. If you think about change moments for other things, other words for it might come up, but it’s one or another kind of holistic response to awakening and opportunity. It needn’t be awakening due to growing life-threatening pressures, but we do hope indeed they will help motivate and inspire our world. When the system awakens to the opportunity it triggers the animal spirits to be felt by and move the whole.
Of course, that is IF successful. Let us hope that’s what humanity will have in mind to do as push comes to shove and the terrifying game of “chicken” we keep playing with ourselves, of using power to multiply power as a way of life, finally breaks.
Paul Maidowski @_ppmv offered to respond to some of the tough questions about Climate change. On Jan 16 I posted the following image of how climate change has only accelerated parallel to economic growth, with no recent bumps or bends in the curve, starting the short discussion below (w/ minor edits for clarity).
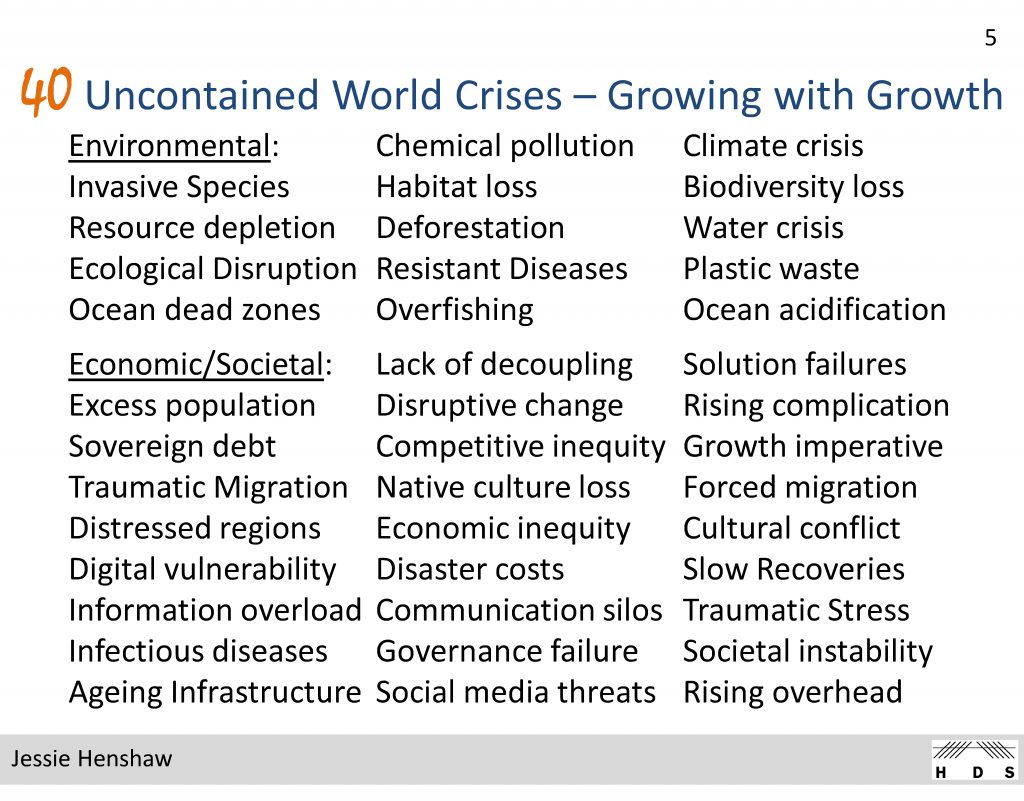
Paul, Why don’t climate scientists take into account the main accelerator of climate change, investors using the economy’s profits to continually multiply the scale of business? Don’t they see the trap? https://synapse9.com/_r3ref/100CrisesTable.pdf…
Paul’s response
Hi JL, amazing document, thanks! I believe the training of climate scientists keeps them from speaking with authority on other fields – or even engaging non-mainstream analyses. they’ve been burned with the hack in 2009 before COP15 at U of East Anglia, and never recovered. Structurally I link this to whatever causes allowed Nordhaus and the economists to sideline Forrester and system dynamics in the 1970s / 80s.
They may see it as individuals, but in their functions, as scientists or in their institutions, they feel they cannot speak to these questions. I think this is changing now, slowly. But of course, it’s very late. What do you think? It greatly puzzles me too.
Jessie’s response
Paul, Good points. I think another major factor is the backroom control of public interest organizations by financial advisors. I’ve seen that at the UNEP and the WRI, two premier research centers, much adding to hesitation to explore outside the rails. There are systemic sources too, like data representing reality to formal research, and money exchange erasing all negative information, the reality of the growing impacts seems to vanish. So, nearly all decision-making is blinded to the growing threats.
Along with every field operating within its own boundaries and the systems sciences failing to make physics methods work (omitting the myriad autonomous systems) about the only honest voices are of protestors who don’t quite see that the problem is really that the financial system is flying blind, IMHO. FYI
My own approach has been to focus on how most people become experts in starting, resourcing, and perfecting their complex home and work designs. Those are like making dinners, doing office projects, and developing lasting relationships, all of which also follow nature’s plan for making new things that last.
So, if we study how people make systems that work well and it is written about, it could give professionals and protesters both a good idea of what we need to do. The critical point in every complex system design is reading the signals to turn from starting to finishing when perfecting the work becomes the key to making its value last. The recent paper on it is: https://synapse9.com/ISSS-21/ISSSJul11NewSci-IndividSys-MS.pdf
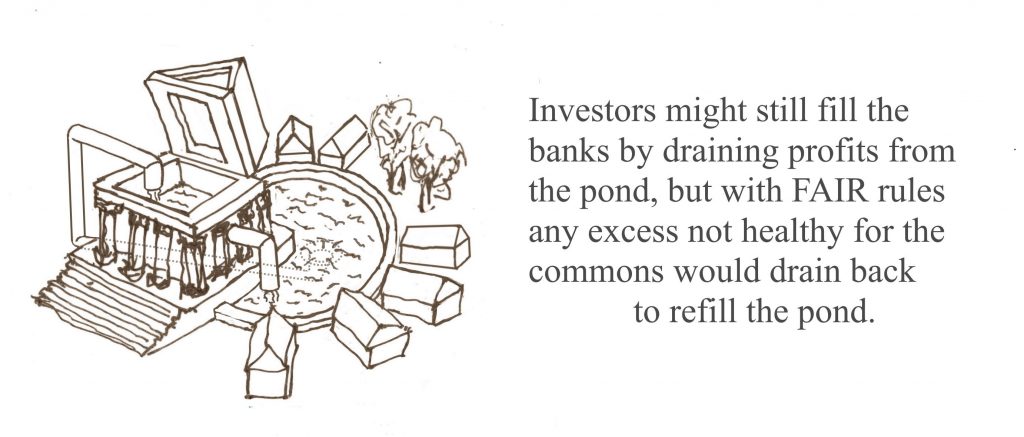
The FAIR rules act as an overflow valve, to redirect excess savings of passive financial income (normally used by investors to extract exponentially more) back to the free circulation marketplace of the pond to keep from draining the pond and guide investor self-restraint in extracting profits from the earth.
FAIR_Money sets a UBD, Universal Basic Distribution, a standard % rate at which investors need to distribute their excessive savings from passive income.
Fig 1. Finance adds funds to free circulation commons, but with strings attached for taking out more as ever-growing profits and escalating drain on the common pool, causing punishing inequality when the economy faces natural limits. To restore balance the FAIR rules ask investors to distribute accumulated profits to qualifying non-profits serving long-term societal needs. That would sustain the profitability of an economy seeking balance with the planet and our need for a good home. .
Title Principles of Fiduciary Asset Investment Restraint (FAIR), simple rules to restrain the compounding of unearned income to reverse the present worldwide continued overproduction of demands on nature and society, our great tragedy of the commons. Ownership comes with natural responsibilities.
Topic Compound investment (adding profits to investments) is required to get any enterprise going, but as seen throughout nature is only what starts things, not what makes them sustainabnle. If overextended what it does is globally multiplies the power of the owners of the world over all others, creating the great array of world crises of neglect disrupting global society and nature we see today.
Asking investors to take responsibility for bringing growth to a climax peacefully, tempering their greed for the common good, appears quite necessary for long term peace and prosperity, even if it still seems quite impossible socially. It seems to conflict with the absolute rights of blind ownership. Now lots of owners are beginning to see the grand catastrophy their habits are causing, and that society’s rules should reflect how people would like to live without looming threats in every direction.
Pitch Flatten the curve of growing environmental and cultural exploitation, to reach a thriving peaceful economic climax.
Image
50050
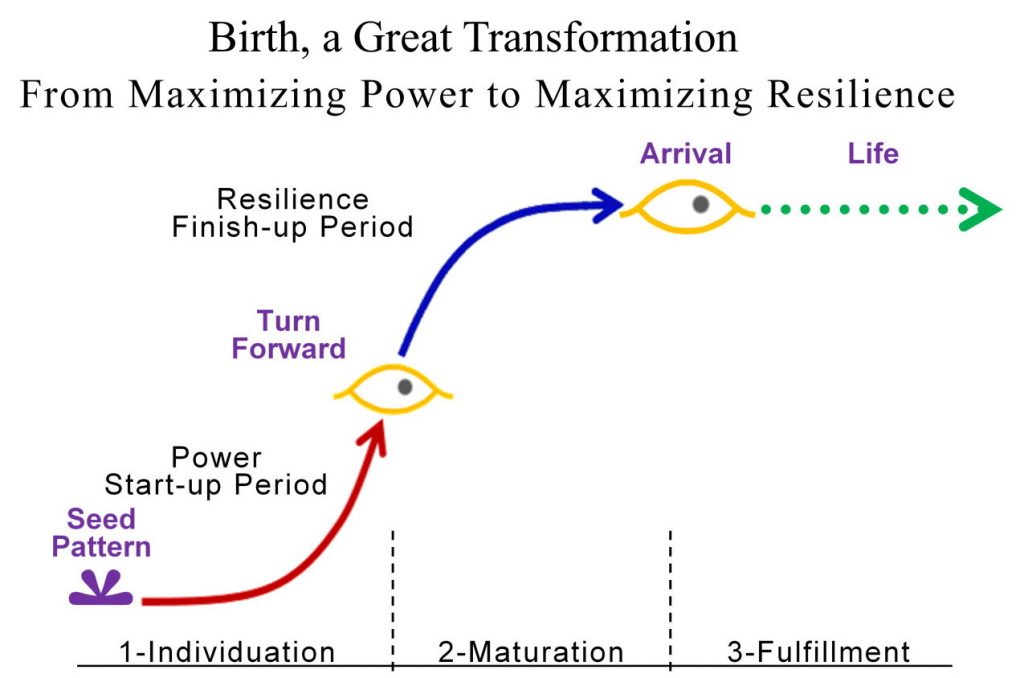
Fig 2 The universal pattern of emerging systems that sustain their climax
Statement The world financial system has but one value, to use the earth and human societies to maximize the growth rate and concentration of financial wealth. That leaves out concern for the resulting matching degradation and disruption of natural capitals and human society. To secure the wealth of nature and humanity we must then have Fiduciary Asset Investment Restraint to prevent the rapid decline of whole system value, and secure a good home for ourselves.
In all fairness, FAIR is just one appealing, comprehensive, and eminently fair way to rebalance the compounding of profits consistent with the long term interests of the earth and humanity. There are also tax and negative interest rate means of “topping off” excess passive savings to restore global balance. The value of FAIR is its focus on everyone’s shared duty to serve common interests. It would of course be backed up by legal penalties and alternate means of distributing excess financial savings, once people see the real need to change our way of living. Of course, all three means could be combined, perhaps led by FAIR distributions by individuals accepting their natural fiduciary duty to care for the earth.
FAIR rules would also only gradually reduce the financial imbalance caused by compound investing, and adjusted to not stifle individual financial creativity as it limits punishing demands on nature and society. Spending a fixed annual share of accumulated profits from investments in times of severe imbalance like today, torturing nature and tormenting wide sectors of humanity, would give investors global guidance on how to value the gifts of nature and human society. One must also caution against the use of FAIR distributions for just reliving symptoms of the systemic overaccumulation of savings, as simple symptom relief would fail to steer people’s lives onto sustainable paths. For example, food and services should be offered, but take a back seat to strong socially led education and self-organization efforts.
This is actually a strategy first discussed by JM Keynes in Chapter 16 iii & iv of his General Theory. I’ve interpreted it as an “overflow valve” for excess financial savings to relieve unhealthy burdens on the earth system, dialing back unsustainable extractive investment and relieving the whole economy’s pressure on all our cultural and planetary bounds.
The degree of relief from excess demands on the system would be adjusted with on experience, starting at 10% a year of accumulated for argument sake. That rate would most often not increase wealth distribution to undermine the individual life styles, just skimm off the top. The rate would be adjusted to gradually stabilize the economy’s impacts on earth and society at a comfortable level, both for long term profit and to treat a living world with respect.
In the end, finance would stabilize to generate steady flow of profits for personal and priority needs, the economy thriving as a continually innovating cash-cow business enterprise. In Hardin’s Tragedy of the Commons, the equivalent would be for the rich farmer to see the error of killing the commons, and devote his excess cattle to relieve community suffering, hosting periodic feasts to save the commons and bring the community together, seeing their right to become a welcome hero for giving up the role as the devil himself.
Need Even ignoring the COVID pandemic, the world faces a considerable growing plague of plagues from centuries of growth putting excessive demands on societies and the environment. A sobering list of The Top 100 World Crises Growing with Growth illustrates the problem. While mainstream finance is starting to recognize the need to not just maximize profits at any cost, so far that has largely been only to factoring the risks to ever-growing profits, not harm to our future. Since maximizing the compounding of profits seems to be the real problem, a new way to do it doesn’t really solve the core problem. It also ignores the very numerous other global crises threatening our future, exposing the grand “tragedy of the commons” of global overinvestment for which we are responsible.
Is that partly a matter of the kind of investment we built civilization with? Of course. A tree can’t change its own trunk, roots, and branches though, only slow the new branches to halt destabilizing overgrowth, if it’s not too late. So we should expect a natural Fiduciary Duty for investors and businesses to develop, to the best of their ability, and guided by the progress of the global crisis. That is a way for responsible investing to become universal without expecting investors and businesses making their decisions to understand all the up and downstream impacts on others or the system’s pressures on its whole range of planetary boundaries. In a way, both forgiving and frustrating, the research on global measures of our economic impacts (Henshaw 2011 Systems Energy Assessment) strongly suggests that causation for whole system impacts is so widely distributed it’s generally necessary to consider them as equally distributed per share of the economy, like today’s nominal average CO2 Emissions of 0.26 kg (0.6 lb) attributed to every $ of GDP PPP. Understanding the CO2 has both historically and currently increased in lockstep with the world economy shows the real problem that forces us to remove the growth imperitive as part of responding to climate change.
Fig 3 the history of Atmospheric CO2, with fixed growth rates from 1780 to 1940 and 1960 to the present
The main determinant of success for FAIR distribution of excess savings is not just the relief of pressure on the global commons it would bring. What matters as much is whether the money is well spent, and delivers “good works” of long term value. The expectation is that people with accumulated profits to distribute, with some technical guidance, would have an “eye for value” and see what the world needs to be successful, having demonstrated a comparable “eye for value” to make themselves successful.
Spending to serve the common interest presents the same kind of creative investment problem only looked at in a new way. FAIR spending is an investment decision for serving the system as a whole, that will be returned with profits of other kinds you couldn’t buy. That is the same way a family benefits from spending savings on educating its children. That is saved profits well spent. It’s a question of “feeding” the world something nourishing, not “controlling” it.
Well spent, FAIR distributions would teach both people and institutions about the patterns of growth in nature, and how investment at the limits is returned manyfold.
Because the FAIR spending of assets is something of a new investment field, it would need guidance and support from economic research and modeling. Also needed is a connection with the social networking of practice communities, both to guide to creating lasting value. Initially, it would be a voluntary adherence to a community principle, and then later formalized to be more widely applied. With new proposals for expansive strategies, the devil is generally in the details so serious economic modeling and rulemaking study to explore options. The scientific study of how finance is coupling with its growing planetary impacts, reliable sponsorship, and teamwork in building the global movement are all critical.
The hope is that the principles are practical and clear enough that they could spread naturally and become socially expected. Even connecting idea that growth is responsible for our problems continually racing out ahead of our solutions should be a task for a global IPCC-like scientific network, perhaps called the IFIC (International Fiduciary Investment Council). That would focus work on systemic research, to guide national organizations on rating impact investments for the commons. Someone will need to attempt to “qualify” the likely impacts of different kinds of for-profit and non-profit grants and investments. Coupled with each investor’s eye for value that could be relied on to steer the economy through its many present crises, including COVID, to a thriving and lasting climax.
Challenge: This proposed “human duty” (to go along with our “human rights”) for investors and business to devote a share of their financial savings to serve the common interest seems simple enough to define and discuss in principle. What’s harder to define is how much time we have to avoid the next wave of crises, as in the past, likely to be as unimaginable to us now as the present ones were before. We should “Build Back Better,” and with an eye to economic, planetary, and environmental justice.
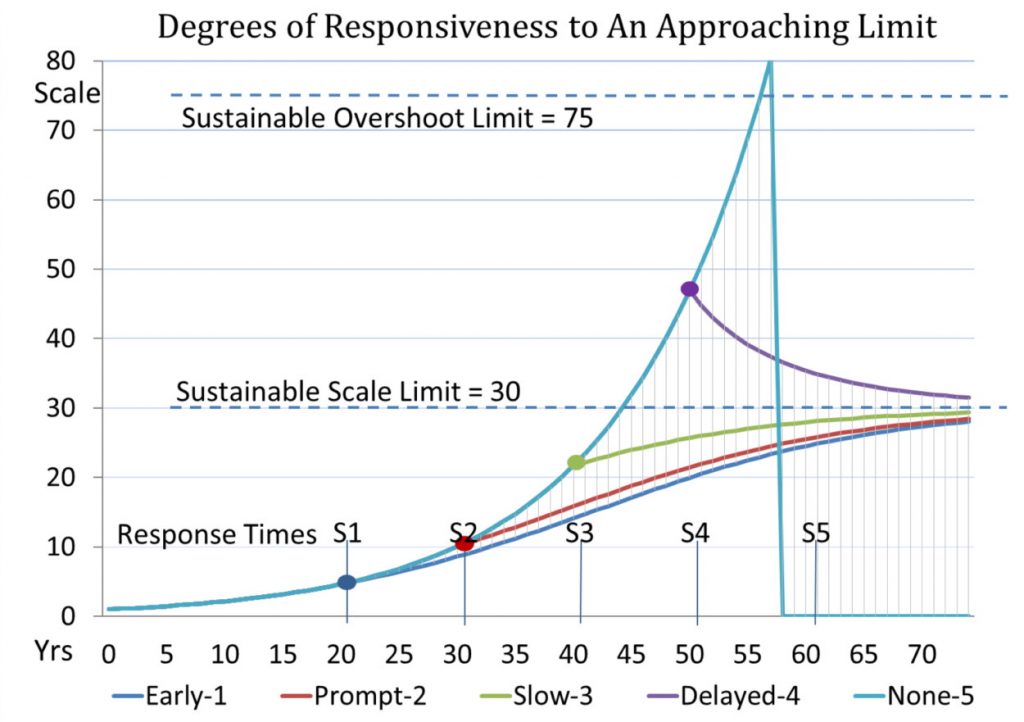
Restoring the economy to maximize its long term growth is the most dangerous course of all, inviting a crippling systemic delayed response like the delayed responses to COVID-19 which caused most of the deaths. If we just restart the growth economy, already severely weakened, you might expect the kind of failure at the limit shown by the light blue upper curve (Fig 4). That choice amounts to no response in the end and leads to system failure. We seem already well beyond the sustainable limit and so only have a last-chance response, to turn toward the sustainable limit like following the purple curve.
Once the world realizes that businesses and investors do really have a natural duty to steer the world economy in the common interest we’ll find more ways to do it. The physics of responding to natural limits (Fig 4) shows that early responses to natural growth limits don’t significantly delay the approach to the limit. It is mainly delayed responses you need to worry about. FAIR principles, perhaps combined with other strategies for topping off excess financial savings, are today likely the only option for making a transition to a thriving climax without major disruption.
Fig 4, The high risk of delay in responding to exponential threats. From Models Learning Change (Henshaw 2010)
Origin of the FAIR Concept: A series of tweets 05/24/20 … and historically, from the work of JM Keynes, 1935 General Theory, Chapter on “Sundry Observations on the Nature of Capital” Chapter – 16 III & IV, describing why the natural financial climax of the economy requires financial savings to climax to prevent the very worst effects of capitalism, implying that the wealthy need to learn to spend rather than save their profits to preserve them, by making the system as a whole sustainably profitable.
Without thinking we use natural growth for many common tasks already, simply by starting things to finishing them with a minimum of waste. In each case you “save the world” from needless excess consumptive growth in getting things started, wasting your efforts and the earth’s other natural and human resources.
Every kind of life, and kind of effort too, begins with building up a system of demands for available resources, to further expand on what built up before.
That expansion by building on what was built is the universal start-up process of nature, also sometimes called “extractive growth.” You see it very clearly in every kind of start-up, of a new friendship, a business, a career, a seedling or a life from a fertilized egg. The all start with steps that build up from what was built before. The build up that making breakfast starts with, for example, begins with the idea of food that makes you hungry, that then gets you to reach into the cupboard, and refrigerator for supplies, and the drawer or shelf for utensils, building a customized system and supplies for making your meal.
Nature’s integral; chaining start-up growth & refinement growth in preparing for a good life.
That process could go wrong, the way mankind’s way of using technology to multiply our making of things on earth exploded, and we now don’t seem to know how to stop. In making breakfast it might similarly go wrong if you got carried away taking out provisions. You might start with a small idea of what you need from the fridge, and add to that bigger ideas as you explore what there is to take out, repeating it to exhaustion perhaps, till the fridge and cupboards, pantry, and cellar, are emptied and all the family’s provisions in reach are mounded on the kitchen and dining-area floor, as you get hungrier and hungrier and your eyes expand way beyond the limit of your stomach, putting nearly all the family’s provisions to waste. The particular outcome is rare, but it is very true that once you get going with growing a process of growing, the process itself can become addictive. Today we clearly see in how we are wasting the earth in somewhat the same way, and love to be moved to tears and laughter by watching Disney’s Fantasia when Mickey Mouse learns turn his chores over to his broom with a magic spell, which gets tragically carried away carrying water.
starting things to finish them with a minimum of waste
Of course, we don’t usually behave that way at all, but at some point near the beginning of taking out provisions to use, switch to thinking about how to get to end of having a satisfying meal. We almost never have the exact end in mind either, but perhaps initially take out eggs and cheese to perhaps put them back and take out bread for toast and milk for cereal if you’re in a hurry. As you put things together you also do various smaller and smaller things you discover to do, to perfect the end result while also arranging the timing to get all the parts to come together at once, with excess provisions put away, all part of getting ready to sit down, perhaps with together with others in the family.
In doing that, rather than letting the initial provisioning of breakfast get carried away, we have “USED NATURAL GROWTH TO SAVE THE WORLD,” most often without really realizing what an enormous contribution to the community and your family was done by simply not maximizing the waste of all available provisions in the process of making breakfast. Of course, it’s also important to do and to watch for in other circumstances, a natural duty for living in a commons.
It seems like a little thing but is actually a very big thing, that we casually do for ourselves and others many times every day
that we casually do for ourselves and others many times every day
People are plenty smart enough to see that this “RULE OF NATURAL GROWTH” (also called “nature’s integral“), to finish up what you’ve started up doing before you make a mess for yourself and others, should also apply to civilization as a whole, and at every scale in-between. People do see that ALL development creates disaster risks, for example, and that boundless development would always creates an all-consuming disaster. Our minds still “get in the way” somehow, transfixed by fantasies it seems, and we just trundle along on the clear path to that all consuming disaster not knowing what else to do.
________________________________________
How this would save the world is really something quite plausible. We already see in progress a great “change of heart” by businesses and investors around the world to join in on averting the clearly disastrous future now directly ahead of us. If that initiates a wave of common sense, with business and investors choosing to follow the wave of the “impact investing” community, averting the looming crises in the most direct way possible, and with much less government involvement. Following that wave of necessity to avert disaster would also turn our world onto the natural growth path for perfecting how we use the earth. You could ask yourself and others to join the wave! The choices of higher purposes include the Green Climate Fund, supporting various SDG goals. The real, macro-economic effect is to distribute wealth in the service of higher purposes while directing profits away from concentrating wealth and raising the economy’s ever growing demands on nature and humanity.
Various other journal entries here discuss more about “what to do”, there’s a whole category with dozens of good little articles and discussions of it. Still, the best way to learn about it is for yourself, from watching how all of life revolves around the variations in nature’s integral, seeing for yourself how ‘start-up’ processes yield to ‘end-up’ processes in taking things to the natural climax of releasing them for their useful life.
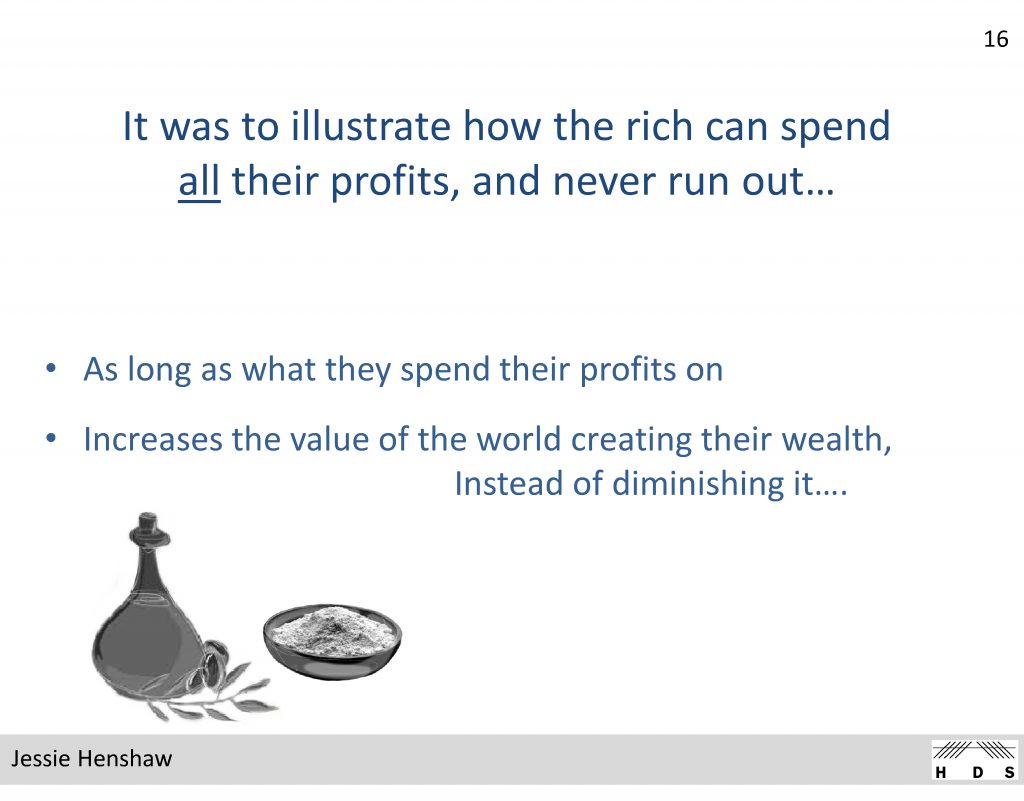
“Finance Serving Life” introduces an updated version of the transformation journey for global capitalism envisioned by J.M. Keynes. He first described it with a biblical fable he called “The widows cruse” (or “Widow’s cup”) based on the 1 Kings 17 story of Elijah asking for food from a poor widow with scarcely any, just a last bowl of flour and flask of oil. To relieve the poor widow of doubt Elijah tells her that if she shares her scarce provisions it will provide generously for both of them, becoming inexhaustible as long as she is in need.
Keynes’ use of the fable was meant illustrate to the wealthy that if growth ever became unprofitable, they could sustain a healthy economy by spending rather than compounding their profits, and have their profits forever be return to them. It illustrates a true natural economic principle of sustainability, that at natural limits to growth spending the profits from investments will become necessary to keep them profitable. That principle is also observed in living systems that repurpose their surpluses at their limits to growth, from being used for multiplying their parts to perfecting their uses and designs in order to thrive at maturity.
Today we can observe that using profits to continue to multiply the parts and demands of the economy on the earth and humanity have become excessive, in total effect impoverishing rather than enriching the both the human and natural world. In principle, though also depending on how it is done, relieving nature and humanity of escalating demands for increased productivity by wisely spending, rather than reinvesting profits would assure that the same level of profits would become everlasting.
Philanthropy and sustainability are among many such good purposes that those with a “good eye for value” might choose at a time such as the present when compounding profits to multiply the parts and scale of the world economy has become increasingly unsustainable. In macro-economic terms, spending the profits of the economy as it approaches the natural limits of healthy development relieves the natural world from endlessly increasing extractive depletion and disruption, while repurposing the use of profits for perfecting the economy’s systems and their relationships with the natural world, potentially bringing endless vitality to the whole.
One of the fine points observers often miss is that a non-growing world economy, using its profits for perfecting its designs for thriving and caring for the planet, would not become a stagnant “cash-cow.” Like a natural ecosystem it could be a thriving and stable system for continual self-reinvention, maintaining as much creative change, i.e. “creative destruction,” as is comfortable. Maintaining that balance of healthy creativity, avoiding both rapacious growth and stagnation, is then the steering job of the transformed economic system.
People are such wonderful designers of systems they put their minds to, and life offers so very many wonderful examples of successful transitions of this kind, from compound extractive growth to long lived creative stability, it is hoped that now that we are faced with the challenge, we could put our minds to it and figure it out.
The current slide set for presenting the concept more fully as a talk or webinar has the same name “Finance serving Life.”
— A presently elevated growth rate of CO2 in the atmosphere directly linked to globalization.
— And resulting likely 1.5 degree C warming by 2030, TEN years earlier than the recent IPCC estimate.
— Plus a fascinating story of diagnostic data science discovery.
Yes, it is a somewhat radical approach, but is fully data driven, meticulous, and at the high side of the IPCC uncertainties, making it plausible. So it should challenge others to try to confirm or dispute the findings. Losing 10 years in preparing for 1.5 degrees C also makes this finding, if true, extremely urgent to respond to.
(A Major Edit of a 10/8/18 version, republished 4/8/19 – Jessie Henshaw)
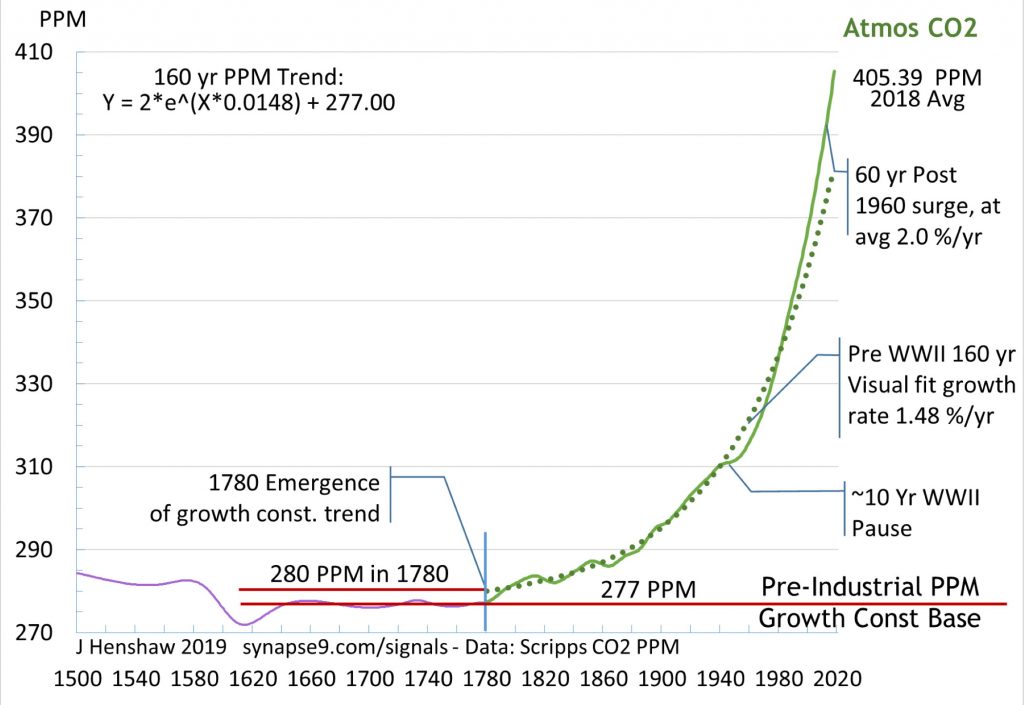
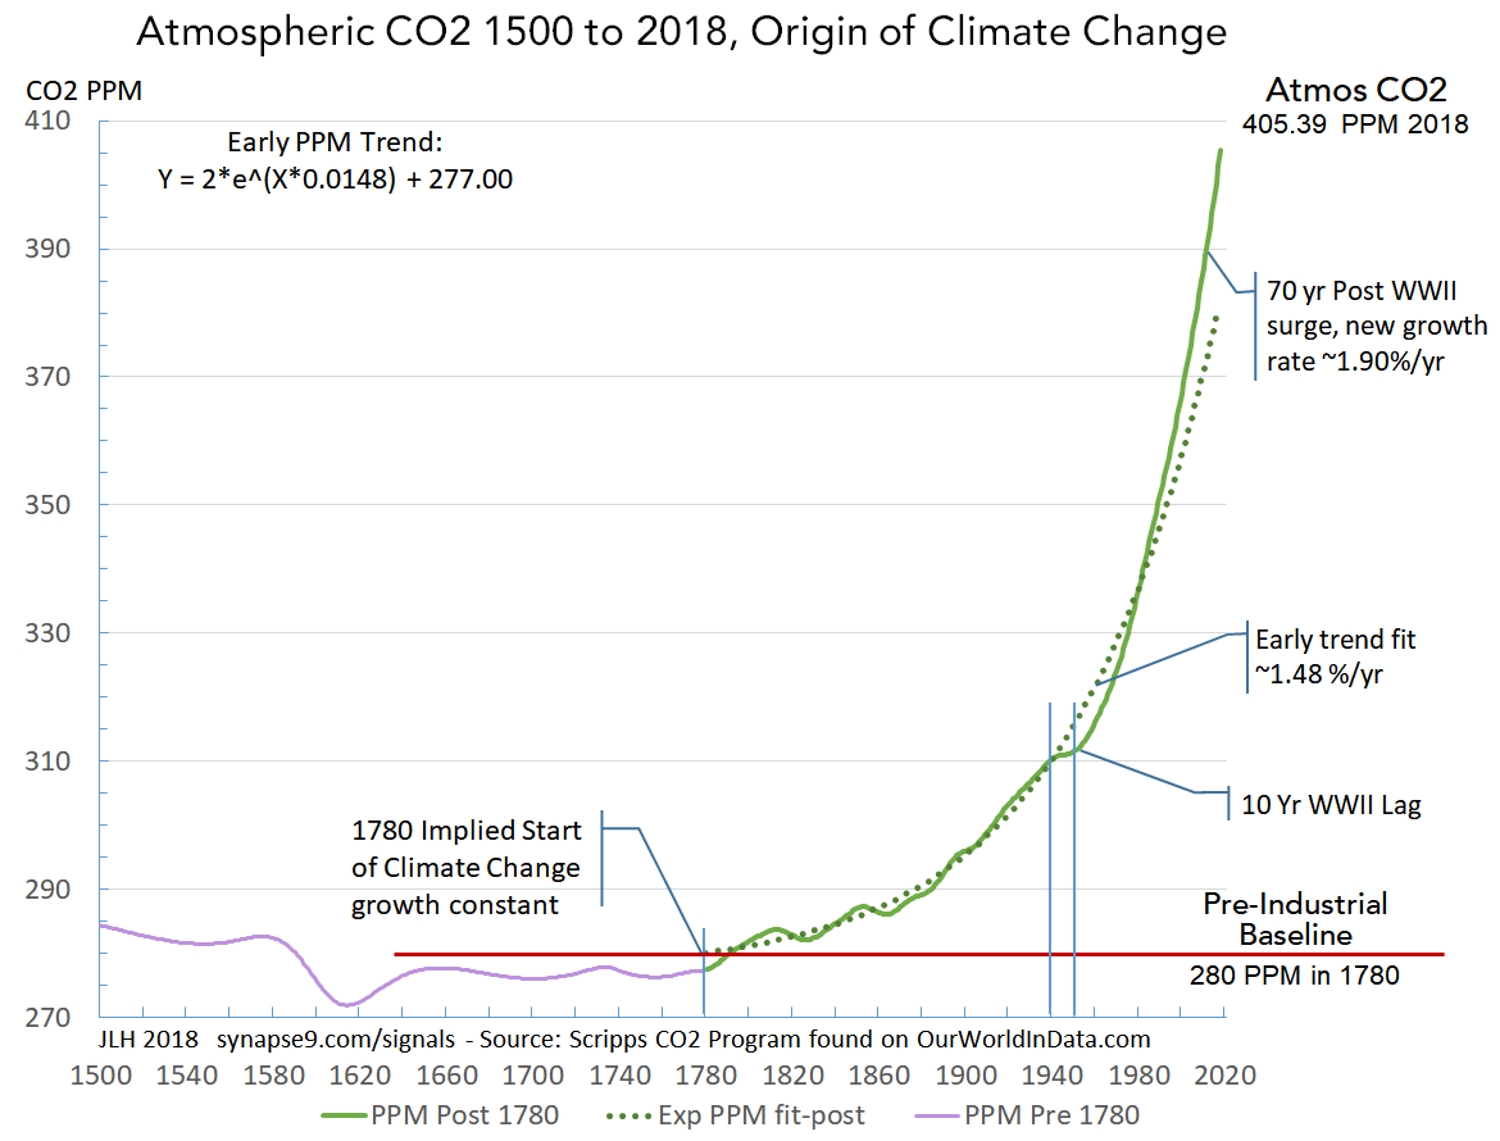
The Path of Atmospheric CO2 – To understand climate change it helps to start with the whole picture, the great sweep of increasing concentration of CO2 in the atmosphere shown in Figure 1, as the main cause of the greenhouse effect. Looking at where it began, you can clearly see the fairly abrupt shift in the trends at about 1780, also about the same time as rapid industrial growth was beginning, seeming to mark the abrupt emergence of fossil fuel industry that the rest of the curve clearly represents.
Look closely at the relatively lazy shapes of pre 1780 variation in CO2 back to 1500 (purple) and how that pattern differs from the abrupt start of the growing rates of increase (green line) after 1780 an how closely it follows the mathematical average growth rate curve (dotted). Note how the trendline threads through the fluctuations in the data starting from 1780. The way the data moves back and forth *centered on the constant growth curve* is what implies that the organization of the economy for using fossil fuels had an constant growth rate, of 1.48 %/yr. Hopefully that seems rather remarkable to you, but the data is clear, that the global economy has a single organization for behaving as a whole, as a natural system, with a stable state of self-organization in that period.
Figure 1 – The abrupt emergence of climate change with the industrial economy, evident in the constant compound growth of atmospheric CO2 PPM at 1.48 %/yr, from 1780 to WWII, followed by a pause and then the transition to the even higher growth rate 1.90 %/yr, That second growth spurt, continuing to the present, presumably reflect the modern reorganization of the world economy for maximum growth informally called “globalization.”
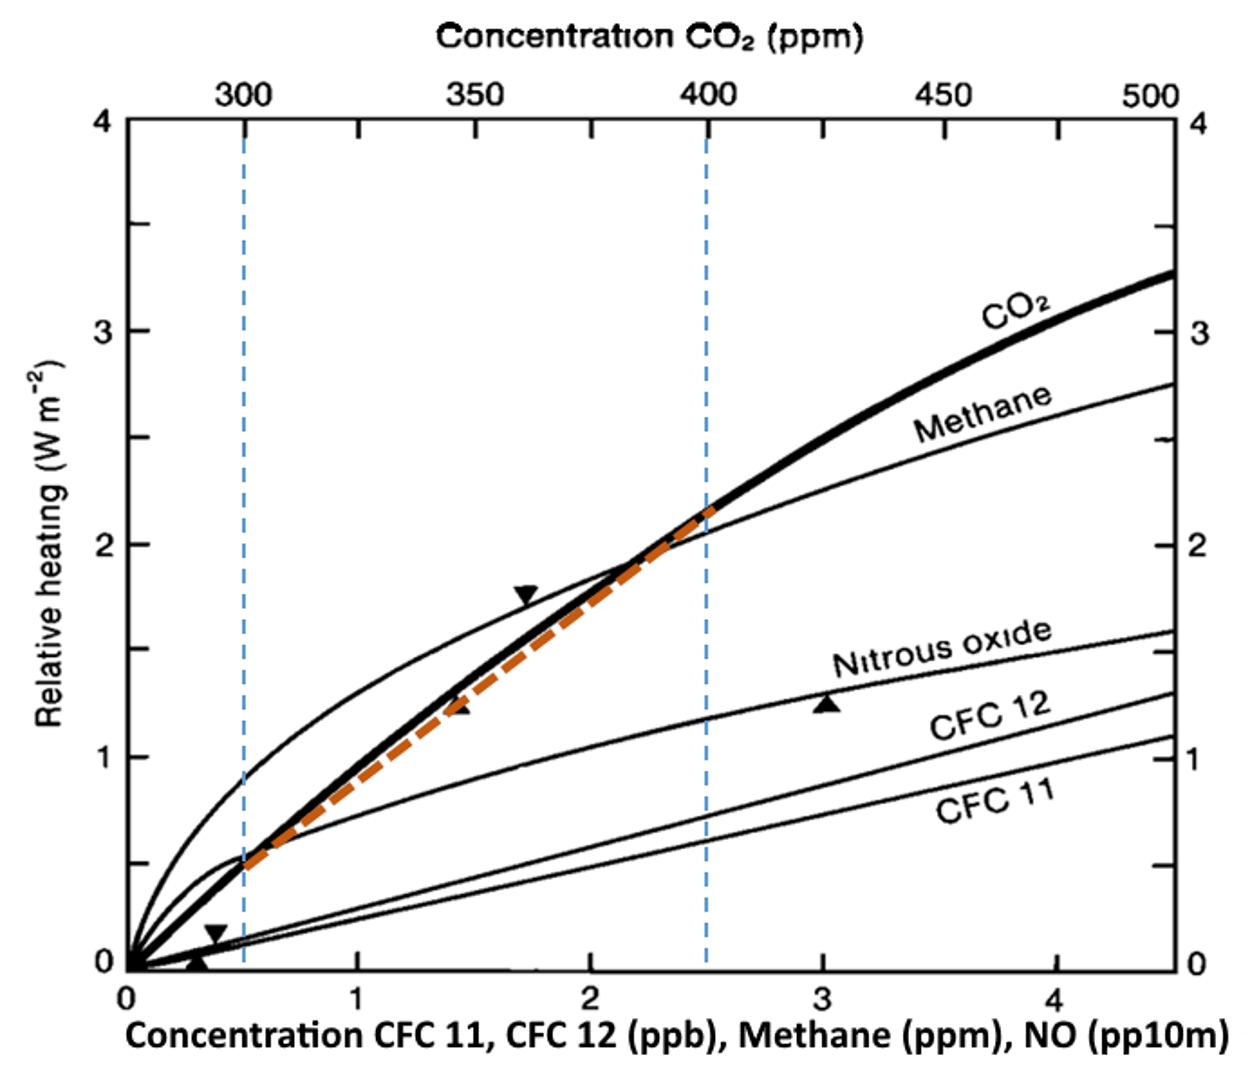
We know from the absorption of heat radiation by CO2, creating the greenhouse effect, that the CO2 greenhouse effect is heating the earth in relation to its concentration in the atmosphere. What implies that relation is close to linear, making the effect directly proportional to the cause, is shown in the Figure 2. The dashed brown line shows the slope of the relation, closely fitting the actual gradual curve, at least between 300 to 400 PPM, the thresholds that were crossed in 1914 and 2016 respectively, a period of 102 years. Atmospheric CO2 is increasing much faster now, though, so the next increase of 100 PPM, to 500 PPM, will be reached much more quickly rising at its current stable rate of 1.9 %/yr rate. If that rate continues 500 PPM will be reached in only 30 more years, by 2046. That large acceleration is the effect of the current higher exponential rate of increase. Of course, considering the rapid compound acceleration of the cause of climate change, and the alarm people are taking now, quite a lot could happen before 2046.
Figure 2 – The “relative heating” of the the earth to Atmospheric CO2 concentration, indicating temperature change has an approximately linear relation to CO2 (brown line) for the range of concentrations (300 to 400 PPM) over recent times. The triangles indicate concentrations in 1985. (Mitchell 1989, Figure 6 w/ added color)
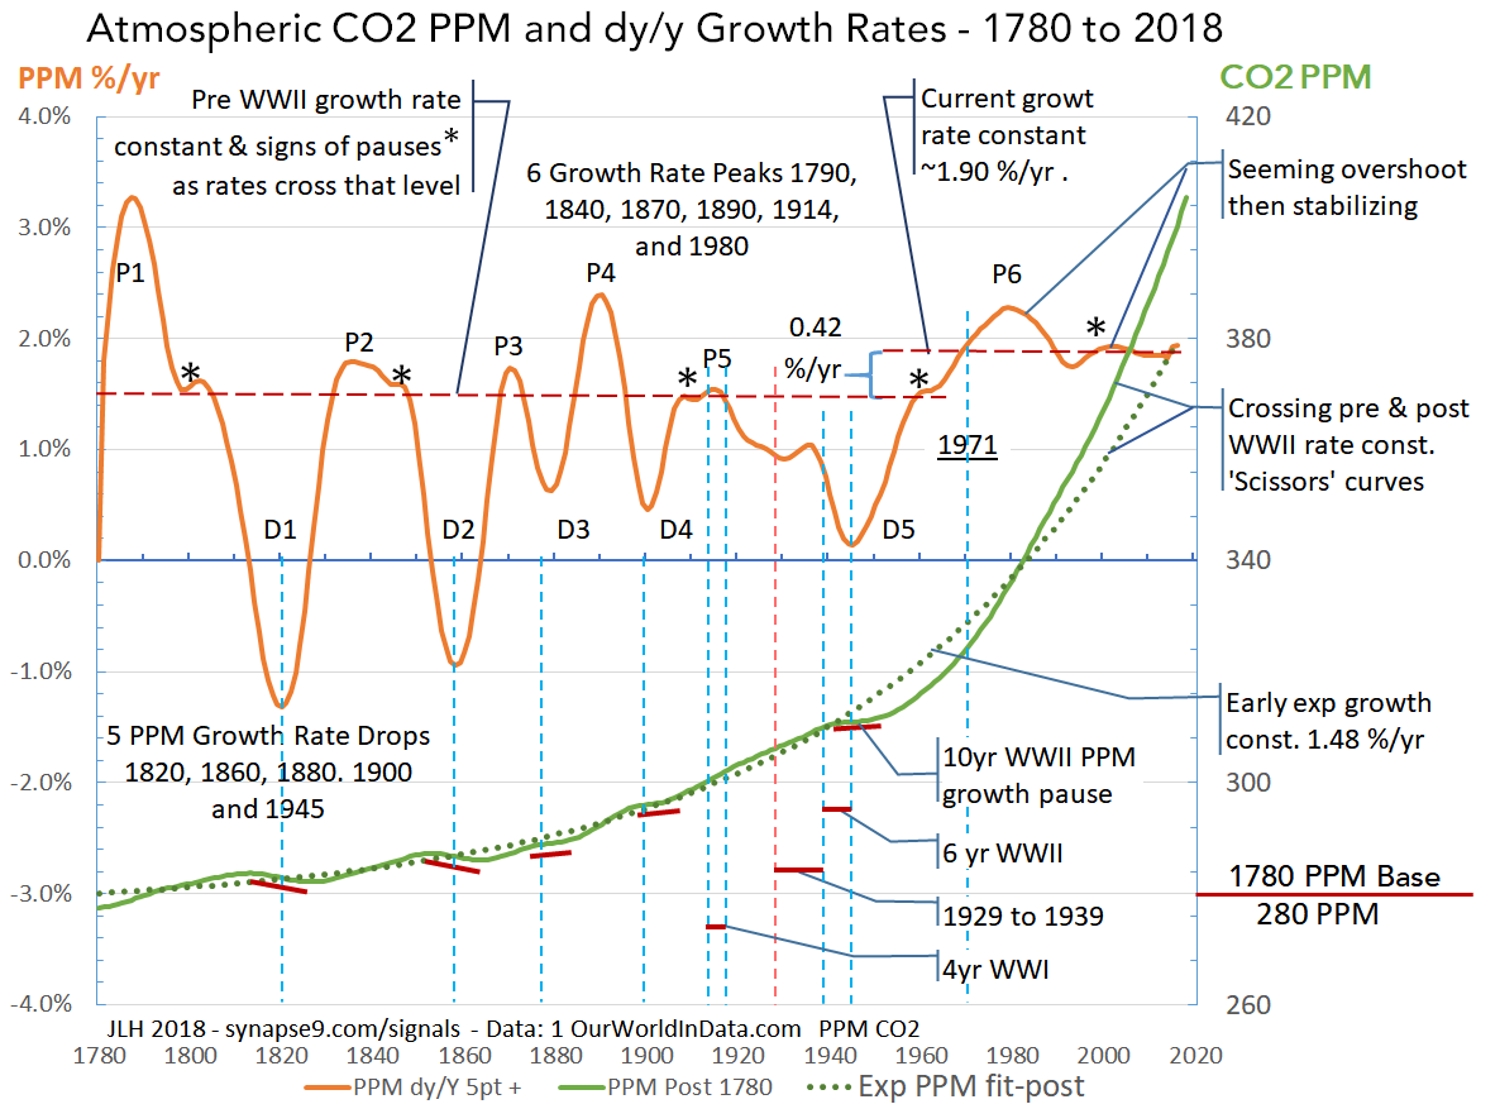
The Annual PPM Growth Rates – Figure 3 shows the growth of Atmospheric CO2 (green) with the details of its fluctuating annual growth rates, to depict both the constants of the growth curve and it’s irregular growth rate interruptions. The individual interruptions raise lots of interesting questions, but perhaps the most important feature is that they are quiet temporary, as evidence of the constant behavior recovering again and again.
The upper curve shows fluctuating annual growth rates (lt. axis, PPM dy/Y) for the curve below, the CO2 PPM concentrations. The peaks and drops of the growth rate align with the small waves in the concentration (rt. axis). Note that the large drops in the growth rate that seem to snap right back to the the horizontal dashed red lines. That seems to show that they mark processes that absorb and then release CO2 again, as they do not seem to affect the average growth rates of PPM concentrations as a whole, around which the annual fluctuations homeostatically fluctuate.
This diagnostic approach is for raising questions like the above, using the annual growth rate to expose the dynamics of the curve for a somewhat anatomical picture. In this case it’s of the homing dynamics of the global growth system as it first hovers around the rate 1.48 %/yr from 1780 up to WWII, and then shifts to hovering around the higher rate of 1.9 %/yr as it stabilizes from 1971 to 2018. You might think of these two long periods of homeostatic growth rates in CO2 concentration as representing periods of regularity in the causal systems, global economic growth and the carbon cycle response, seen through the lens of atmospheric CO2.
You might think the large departures from the regular trends would be great recessions perhaps, that then “make up for lost time” on recovery. I could not find corresponding recessions, though, and for the great recessions I checked there do not seem to be notable dips in CO2 accumulation. To validate this kind of research one has to go through that kind of thought process for every bump on the curve, either a tedious or exciting hunt for plausible causes than then check out with other data.
What seems most unusual about the big dips in the CO2 growth rate (D1, 2, 3, 4, 5) is that 1) they do not occur after WWII and 2) they rise and fall so sharply and have no lasting effect, seemingly temperature sensitive as well as absorbing CO2 later released. I can’t say whether it is feasible or not, but something like vast ocean plankton blooms might have that effect, absorbing and then releasing large amounts of CO2. There’s also a chance the way the raw data was splined and the growth rates smoothed, to turn irregularly spaced measures into smooth curves, might also have unexpected effects. Whatever phenomenon causing the big dips was, it appears to have been interrupted by the rapid acceleration of warming that followed WWII, as evident in the smooth and uninterrupted rise in most recent and best raw data. Those are at least pieces of the puzzle that might help someone else narrow it down.
Figure 3. Atmospheric CO2 concentration (CO2 PPM)(rt. scale) and its annual growth rates (PPM %/yr)(lt. scale), showing the change in growth constants before and after WWII. The key evidence of these being different organizational states of the world economy (before & after WWII) is regular “homeostatic” (home seeking) reversal of trends departing from the growth constants. It is the post WWII growth constant state of 1.90 %/yr that is preventing normal policy process from intervening in climate change, and needs to be “recentered” on learning from nature rather than overwhelming nature for our survival.
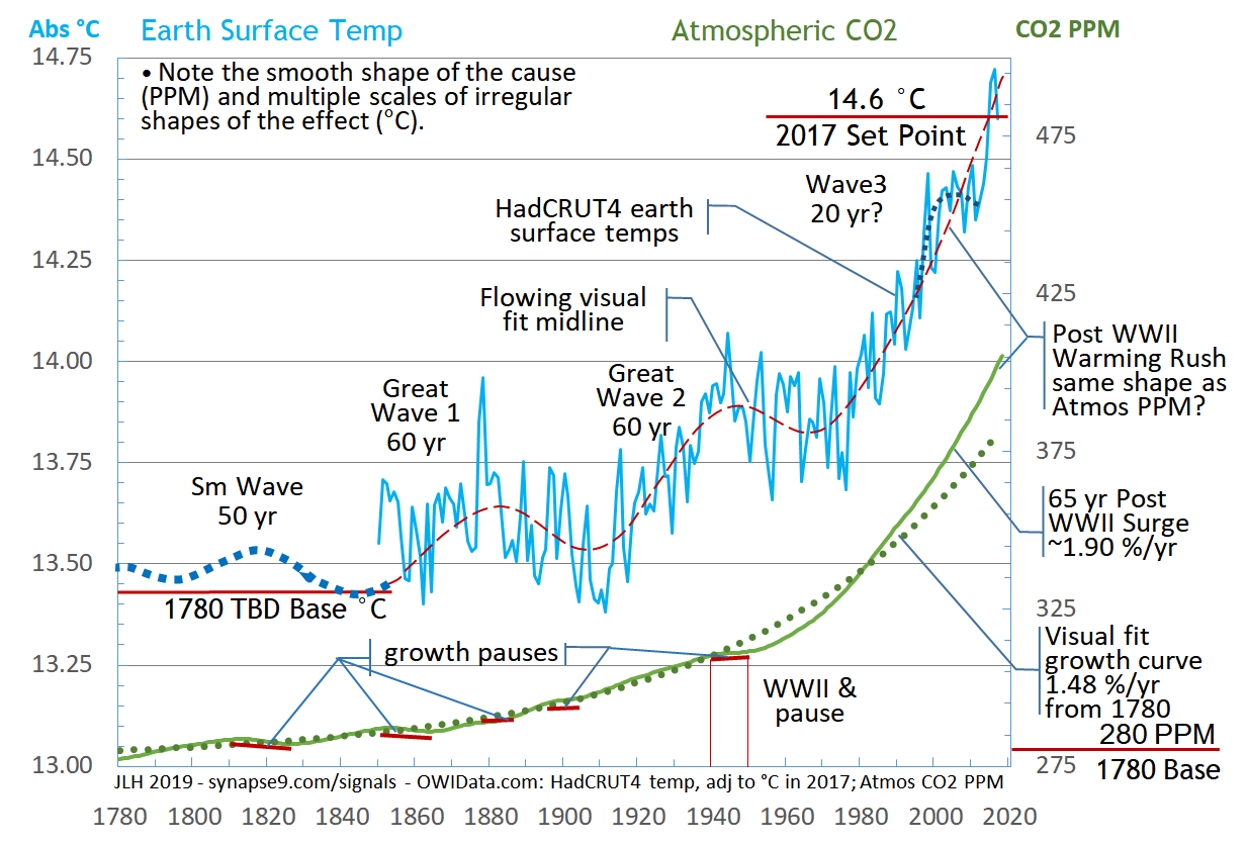
Comparing the CO2 cause and degree C effect – The main purpose of Figure 4 is to compare the history of earth temperatures (blue, ‘C, lt scale) with the curve of atmospheric CO2 (green, PPM, rt scale). The CO2 PPM data is the same Scripps atmospheric CO2 data and scale we’ve seen below. The temperature data is from the HadCRUT4 records used by the IPCC. In this case the original anomaly data relative to the 1850-1900 average have been converted to absolute ‘C values, using a conditional set point of 14.6 ‘C in 2017. In a way it is as arbitrary a coordinating value as the others people use. It’s chosen here first for being a more familiar scale, but also so that 1780 initial values for PPM and ‘C can be determined as initial values for the greenhouse effect. Those baselines are essential for defining the exponential growth rates of the PPM and ‘C curves. The 14.6 ‘C value was based on an expert’s estimate.
Figure 4
Aligning the curves for Figure 4 lets us look closely to see if any shapes of the cause of the greenhouse effect (PPM) are clearly visible in the shape of the effect, global warming (‘C). Does anything in particular jump out? First might be the differences, one curve quite smooth the other jittery, both having wavy fluctuation patterns too, but of very different scales and periods. The first thing you might ask about is how regularly irregular the ‘C curve is seems to be. That variation is thought to be mostly due to annually shifting ocean currents, along with weather system changes and the difficulty of measuring the temperature of a complex varying world.
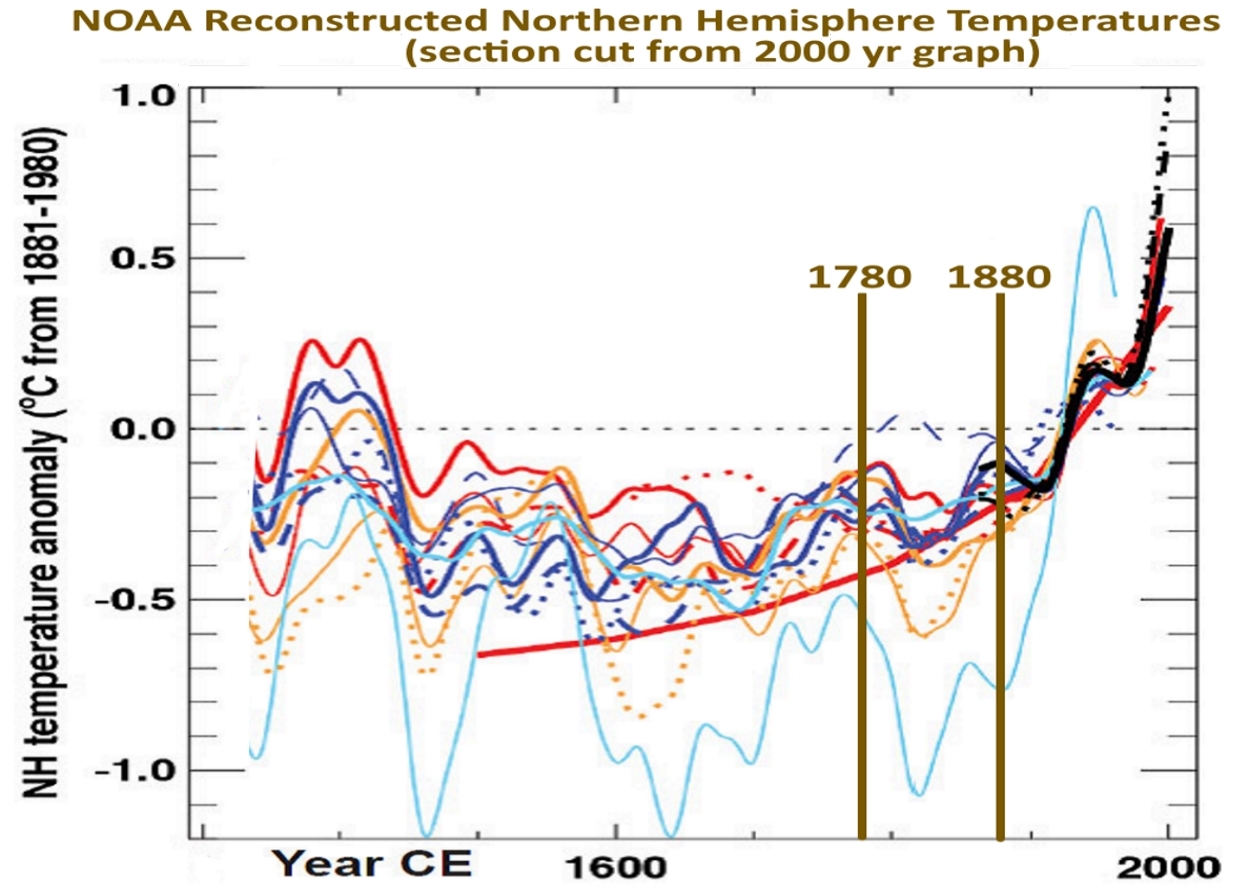
The ‘C curve (Figure 4) also shows the two ‘Great waves’ (#1 and #2) in earth temperature that appear to be independent of the greenhouse effect. The dotted red line was visually interpolated as the midline of the irregular but seemingly quite constant fluctuating annual temperatures of the HadCRUT4 data. The blue dotted line was added to suggest earlier large waves in earth temperature copied from the shapes in the ancient temperature reconstructions seen in Figure 5. I physically overlaid those reconstructions of ancient temperatures on Figure 4, drawing a continuation of the Figure 4 midline curve that fit the Figure 5 curves.
One might say the minima of the great waves in the ‘C curve display a trend somewhat like the general trend of the PPM curve, say from 1780 to 1980. The one shape that makes the two curves seem really connected, though, is the way the sharply rising PPM curve (the implied cause) and ‘C curve (the implied response) both start following a “hockey stick shape” in the 1980s. It even seems the shape of the ‘C curve interrupts the great waves as it takes off exponentially, breaking a rhythm that seems to go back many centuries. There is a possibility that the great waves represent upper atmosphere standing convection patterns waxing and waning, something that increasing convection intensity could interrupt. Perhaps that would help others find what the great wave cycle, or not. Since theory suggests the trends of both cause and effect have a linear component Figure 6 shows a linear scaling of the PPM curve to see if it and the ‘C curve can fit.
Figure 5 – NOAA (2007) 1300 to 2007 Northern Hemisphere record of temperature reconstructions. Measured from a 1881-1980 baseline. This it taken from a longer history keeping the units and adding a title and dates 1780 and 1880 (brown). That is the period after the greenhouse effect began before it was visible in the records of earth temperature. The red line shows an old NOAA speculation that warming developed earlier and slower than found here.
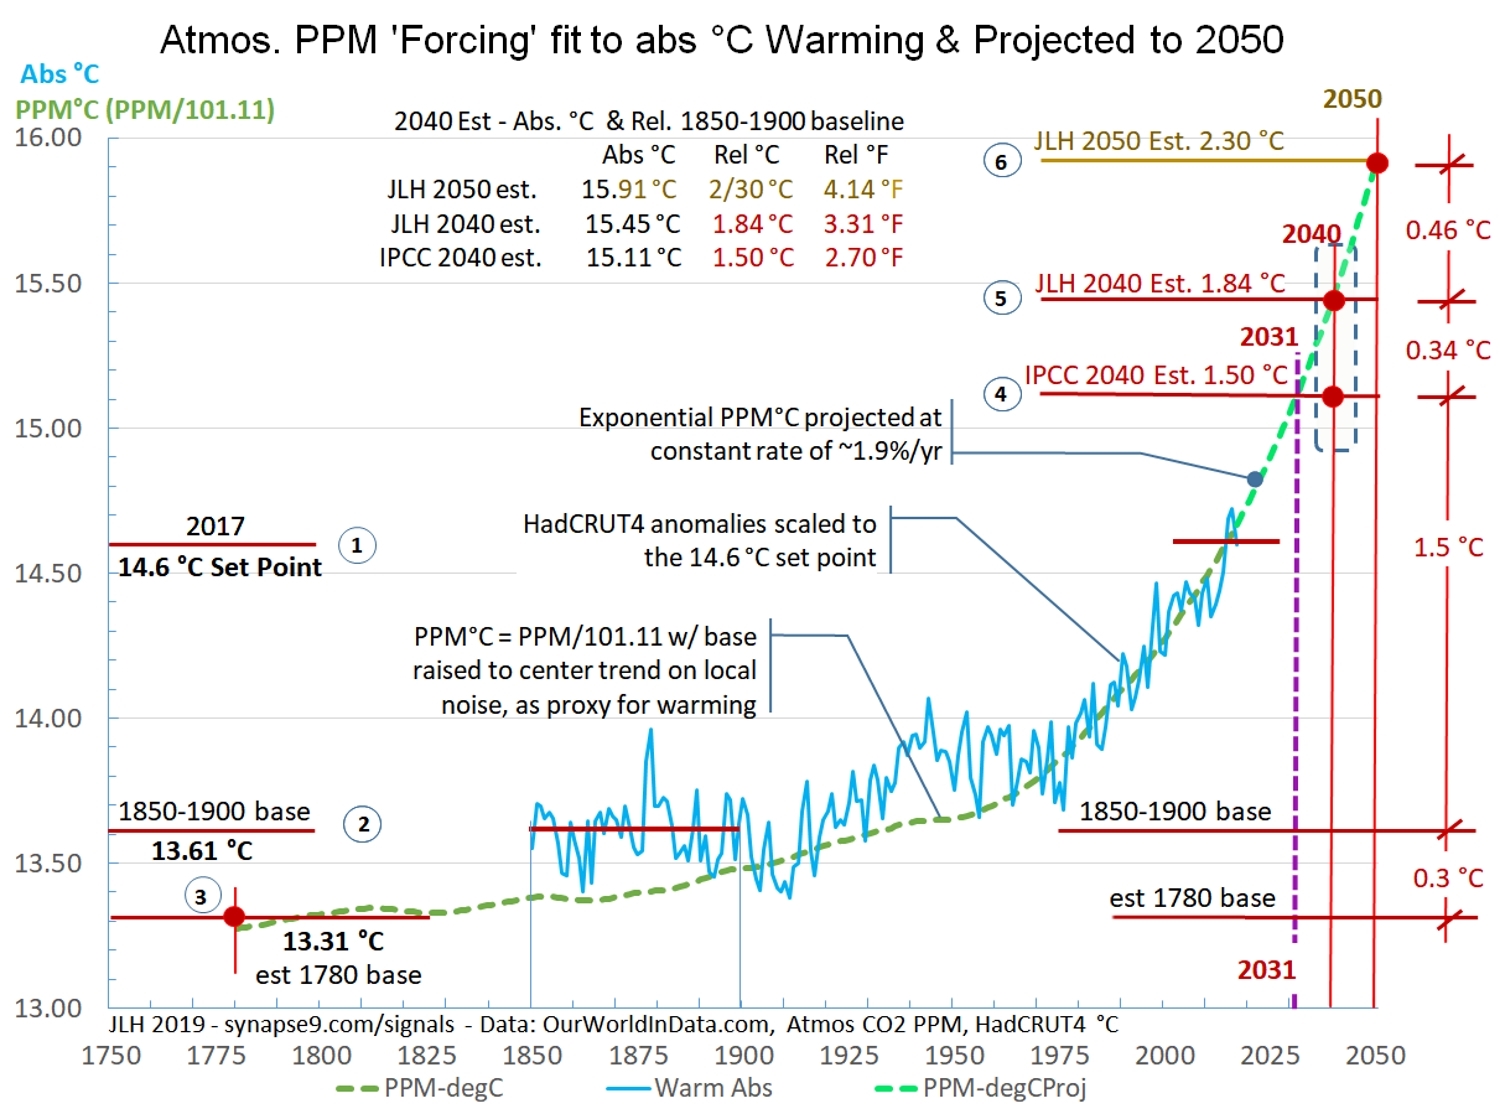
Scaling CO2 PPM to Make a ‘C Proxy – The reason to scale PPM to emulate the dynamics of ‘C curve is simple. The ‘C fluctuation is so erratic the variety of curves to predict its future is rather extreme, so people have been generally using a straight line. An exponential curve is not a straight line, though. So the quite regular shapes of the PPM curve, including its clearly measurable growth constants, 1.48 % before and 1.9% currently, do make it a prime candidate as a useful proxy. Even if the trend has a clear direction now we of course have to allow for increasing uncertainty over time. Adding to that are the plans for dramatically cutting CO2 despite a world economy dramatically increasing its production, a tug of war that could be interrupted by actual war or other economic downturn.
Where the current stable growth rate of climate change seems headed, knowing the PPM curve should be linearly proportional to the greenhouse effect, we experimentally scale CO2 PPM see if it fits the ‘C curve in a logical way (Figure 6).
Scaling the PPM curve to fit the ‘C curve makes a PPM’C proxycurve, hoping to fit the midline of the highly irregular ‘C curve from 1980 to the present. Both the units and the baseline are not determined, though, to produce the proxy curve in PPM’C = A*PPM + B, using a linear scale factor A and a baseline B. A third determinant is then finding a optimal fit between the very different earlier shapes of the curves. So basically I tried lots of things, and found my initial assumptions were mostly wrong. Initially I made the mistake of trying to fit the PPM’C curve to the midline of the earlier ‘Great waves’, and tried several ways until it was clear they were all wrong.
Then I realized those earlier great waves were really not related to the greenhouse effect. So my greenhouse effect projection might better be interpreted as coming up under the earlier systems, like it actually looks. That was purely a graphic device at first. Then when I adjusted the PPM’C curve to pass under the ‘Great Waves’ I set it to go through the miline of local fluctuations instead of the Great Wave departures. Suddenly the fit of rapid growth period became as perfect as I could ask for. I spent some time trying to figure out why, studying all the loose ends, in the end resolving that’s what the data seemed to say. That PPM’C curve then becomes the hypothesized most likely “real” rate of greenhouse effect climate change, and offering a much more narrowly regulated way for projecting its future.
Figure 5 shows both the best fit scaling of the PPM’C proxy curve (dark green dashed line), and its extension to 2050 at its presently stable growth rate of 1.90 %/yr (dashed light green line). Yes there are various uncertainties, but the threat of climate change so far has seemed to be from underestimating, not overestimating, and the findings do appear to be well within the IPCC uncertainties given the difficulty of projecting the temperature data directly.
I think it means that reaching 1.5 ‘C by 2030 is a much more probable estimate of the current trend than reaching 1.5 ‘C by 2040.
Figure 6 – The PPM’C curve scaled to closely fit the HadCRUT4 data and then projected at the homeostatically stabilized growth rate of observed in atmospheric CO2. How long this projection might hold depends on how robust the global natural and economic systems driving the growth rate in atmospheric CO2.
The Economy as a Whole – How great a new threat this acceleration in atmospheric CO2 pollution and its greenhouse effect are seems to rest on just how stubborn the global homeostatic regulating systems observed are. That could really change the climate mitigation picture, and help explain why there has been only negative progress in slowing CO2 pollution. So far is seems to have been neglected, with negotiation over mitigating climate change not seeming to take into account the organizational inertia and persistence of the global economic system as a whole.
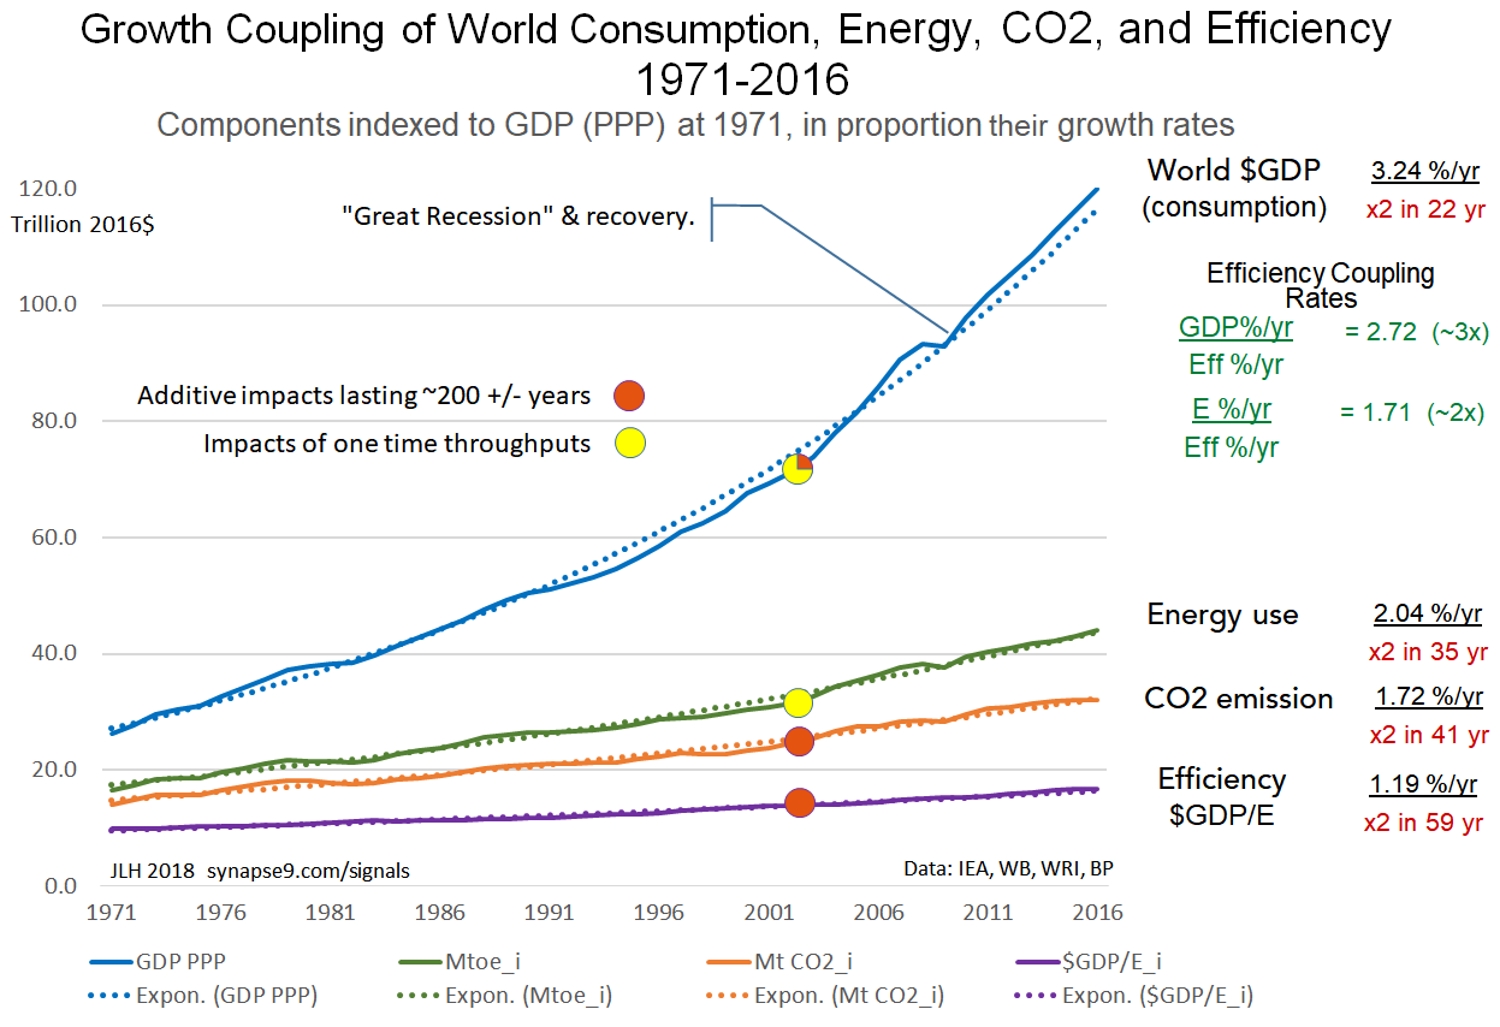
Figure 7 shows a group of major indicators of the global economy that were selected for having constant growth rates from 1971 (the earliest data for some) to 2016. The GDP PPP curve in trillions of 2016 dollars is growing the fastest, and each of the other curves was indexed to GDP in 1971 in proportion to their relative growth rates. For example, since total economic energy use is growing at about 2/3 the rate of world GDP that variable was scaled to 2/3 of GDP at 1971. This device displays the steady relation between them called “coupling.” That the same proportionality of the growth curves is constant throughout it indicates each of these curves reflects the behavior of the same system. What seems to cement the view that the global economic system appears to be behaving as a whole is the visual evidence that the data of each of these series, like the CO2 PPM data we discussed at length before, seems to fluctuate homeostatically about the growth constant.
What physically coordinates the economy’s coordinated relationships between different sectors displayed here as growth constants seems likely to be cultural constants of each cultural institution, or “silo” of the world economic culture. Every community seems to develop its own expected way for things to work and change and seems to become the way the different sectors end up coordinating their ways of working with each other. That all of this is organized primarily around the use of the exceptionally versatile resource of fossil fuels then indicates that a deeper reorganization of the economy than a swapping of one set of technology for another will be involved. It should suggest to any reader just how very much of the world economy would need to be reorganized, and to be reminded that the last times the world economy was sufficiently disrupted to be reorganized were during WWII an the 1930s.
This topic is also the subject of a longer research paper. Science review drafts are likely to be available later in April 2019.
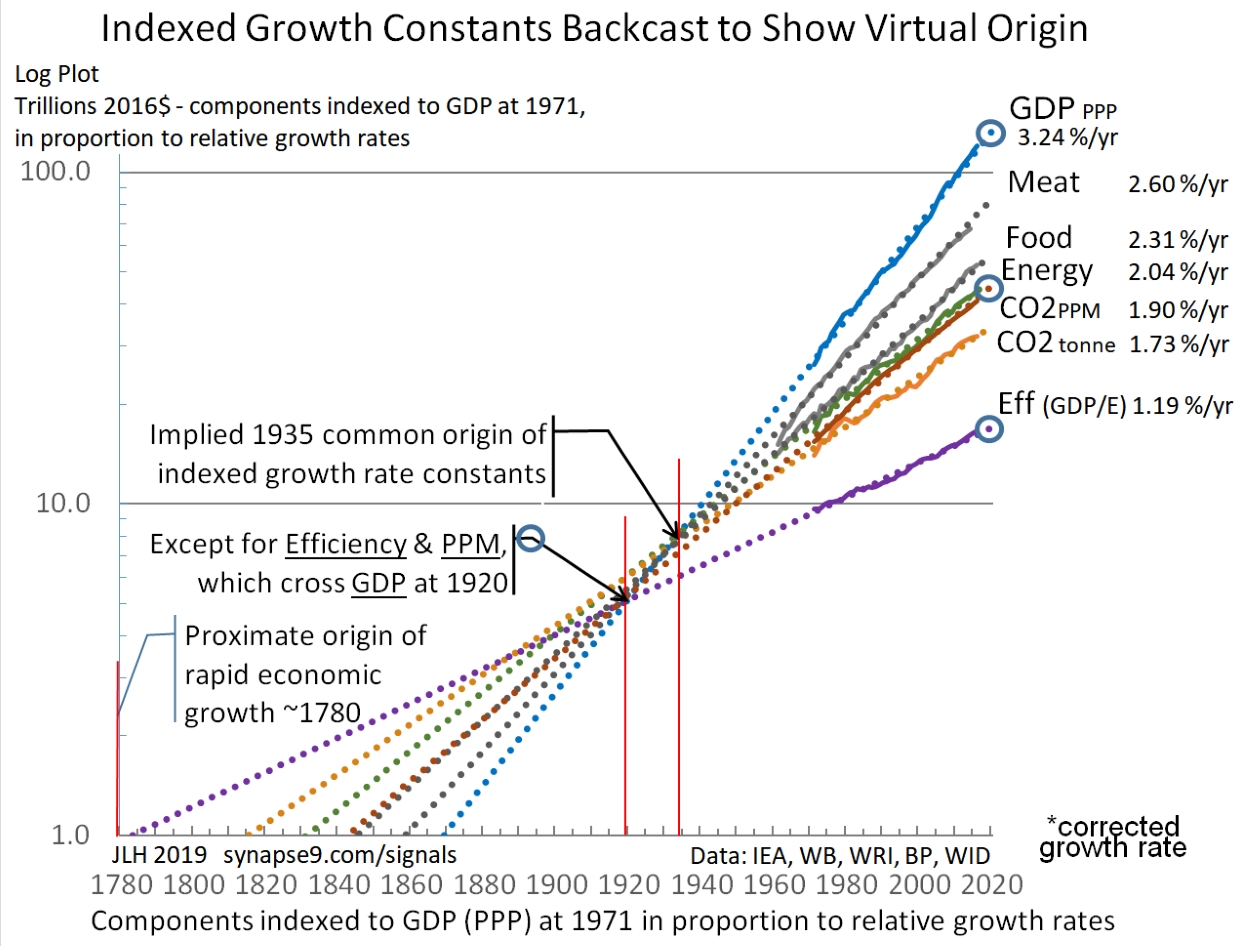
Figure 7. The global economy working remarkably smoothly as a whole system of coordinated parts, seemingly much like theory says it should, but most people don’t see because they don’t look at the behavior of the system as a whole.Figure 8 – Smoothed annual growth rates of recent world energy use and CO2 emissions, showing close coupling of their fluctuations with relatively insignificant trend.Figure 9 – Log Plot of Figure 7 variables with a 1780 to 2020 time scale. The backcasting of their exponential constants displays the convergence with the backcast GDP trend of four of them at ~1935 and with two others (blue circles) at ~1920. The effect implies the stable coordination of the parts of the global economic growth system established by the 1970’s was in the 1920s and 30s.
Work in progress… Below this line is old text that may be edited in pending updates.
It’s a powerful technique for understanding complex systems, such as the world economy, that behave smoothly as a whole. The most important observation is just that. The system as a whole and these whole system indicators are not separate variables, and the smoothness of the curves shows the system as a whole behaving smoothly as a whole over time.
From our local views of the world that often does not seem to be at issue, though it really is the main force behind all the changes everyone is struggling to adapt to. Individual businesses, cities and countries generally have a quite irregular experience, as their roles in the whole continually change. What the smoothness of the curves and the change in the system as a whole really means is that the world economy is working the just the way it is (financially) supposed to. It is being globally competitive the way money managers manage it, and continually reallocating resources and business to where they will be best utilized, resulting in most every part having somewhat irregular experience to make the whole behave smoothly. The uniformity of these global indicators also says is that their origins all point back to ~1780, when modern economic growth began. We have reasonable measures US economic growth from ~1790, …and so went the world!
Smooth exponential curves and the systems generating them are, of course, among the things of nature with inherent “shelf lives”, relying on systems of developing organization of multiplying scale and complexity, certain to cross thresholds of transformative change. In nature, growth systems generally develop to one of two kinds of transformation, stabilization or destabilization, the crashing of a wave that doesn’t last for example or the thriving business that can last for generations. What characterizes the difference for the emerging systems that last is that, while becoming strong with compound growth (like the systems that don’t last also do), they become responsive and refine their systems to stay strong. In economic terms that’s remaining profit seeking they “internalize their externalities” to mature toward a peak of vitality rather then failure. It’s a choice made in mid-stream.
Understanding what will make that difference in outcome for our global growth system will partly come from people getting a better understanding of how we got here, as shown in the Figures 1, 2, 3 & 4. The growth of technological civilization relies on ambition, creativity and resources, and methods that we could potentially change. How economic growth is largely managed by the application of business profits to multiplying business developments, what makes GDP to grow. If our decisions were to internalize our externalities that is also one of the things that might change, without really changing human ambitions, creativity or resources.
I’ve been observing the UN SDGs as a natural systems scientist since 2013 when I saw with some surprise that the one topic both Country delegates and Civil Society groups could agree on was the wording of the ideals for global development. Even when the Co-Chairs, Ambassadors Korosi, and Kamu, began persistently asking for the discussion to turn to means and methods it never did. Ideals are wonderful, but the strains the SDGs are responding to are still growing, as the global disruption of human cultures by the growing intrusions of the economies of the world powers continues. That’s a problem not yet to be studied and discussed. Why? Partly to be “diplomatic” and partly not having a model for human cultures as living social organisms that carry all our shared ways of knowing living. Still we need a way to discuss the rapidly growing strains on human and ecological cultures caused by accelerating economic growth, a global cultural sickness.
As growth presses the limits of the earth and challenges the world to ever faster rates of change, the damage to nature and human society is more and more lasting. That’s a conclusion you can reach from many directions I think. The communities the SDGs aim to help seem mainly deeply rooted old cultures that are now “failing to thrive.” That is a living systems problem, not a numbers problem, as the SDGs were designed to solve. Failing to thrive is more like a “lack of meaning in life” dilemma, requiring a different approach. It’s also a symptom that one can use to map the problem worldwide and begin to look at its real dimensions.
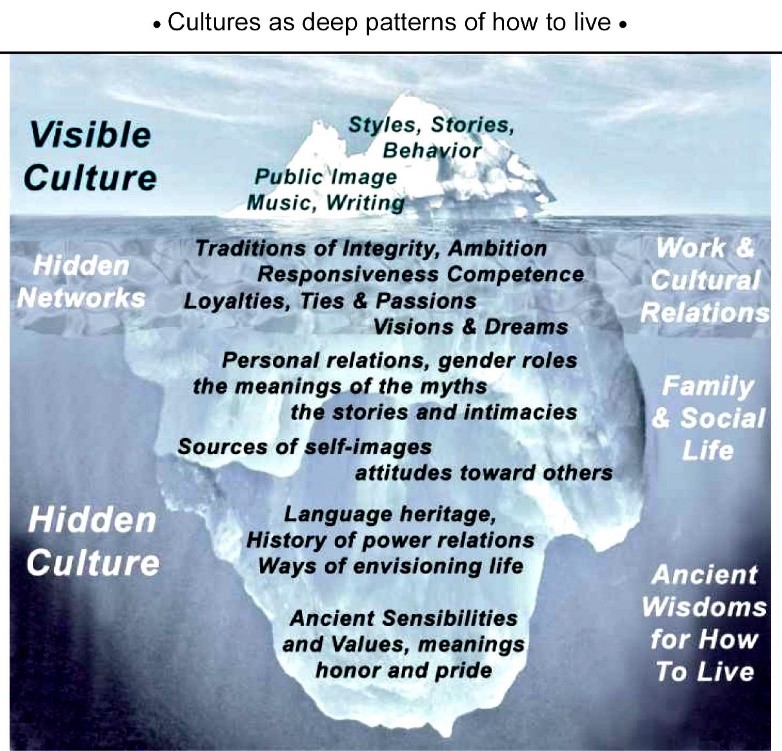
Our accumulated ways of knowing and living are stored only in our cultures
Failure to thrive seems to hit both indigenous cultures worldwide and communities within economies where “creative destruction” is leaving lasting scars, like rural flight or outsourcing that hollows out a region. One example is the deeply alienated culture giving support to Donald Trump in the US, distressed by the world changing so much around them. There are also non-thriving local cultures in North, Central, and South Africa, as well as in the Middle East and North, Central, Southern and Eastern Asia, as well as in Oceana, Australia, North and South America. It’s not “the same old thing,” but a truly accelerating global plight, seeming to be of all the cultures that didn’t welcome or were disrupted by the intrusive growth of the world powers.
Human cultures are truly the crown jewels of humanity, though, where most of our gifts come from and are on display. They are the unique individual species of the human ecology. If you think about it, there is no other place on earth for the safekeeping of all our ancient accumulated ways of knowing and living. Each culture either crafts its separate way of knowing and living or branches off from another. They are our most important gift, evidently now absorbing a great deal of abuse.
With each culture being its own “knowledge system” it keeps people from making sense of any other culture, or even our own. If you trace the evidence, it does check out. We get the large part of our ways of understanding things during early childhood, by what you might call ‘osmosis’. Some say it’s “too close for us to see,” or that our mental way of seeing is functionally like a camera and its lens, that are never visible in the pictures they take. Cultures also have a deceptive “cellular design.” Their ways of knowing and living are internally shared, and not experienced from the outside. Even with extended immersion, an outsider does not develop a native feeling for another culture’s roots.
The great challenge we face today is that growth is an ever faster process of expansion and change, *doubling* its demands on the earth and humanity every 20-30 years. That radical rate of increasing demands is what eventually overwhelms the adaptability and resilience of people and the earth. Living things are being pushed to keep mechanically doubling numerical returns for culture-blind investors, as if the earth was unoccupied.
That’s how the English occupied North America, a hundred years after the first settlements rapid expansion began with importing slave labor then a wave of settlers swept across the rest of the continent, as if it were unoccupied. Elsewhere the economic powers built systems for globally harvesting resources, placing overseers where needed to manage their access, as if there was no one else there. Today it continues with how global capitalism still relates to the world, measuring its success in rates of accelerating expansion alone, as if no one is here. What’s most surprising perhaps, is how very effective our cultural blinders are in hiding our blindness to our own and other cultures from us. That is, hidden until you have an indicator like the glaring disruptiveness of ever more sudden change.
So what would relieve our fast growing societal distress? There’s a new business model expressly for responding to it, to use biomimicry for how nature builds thriving ecologies. If interested there’s a longer discussion article on how healthy cultures are the foundations of healthy economies and the business model for nourishing our cultures, that I refer to as “True Public-Private Partnerships” (tPPPs) discussed more in the essay Culture, Financing for Development and tPPPs.
The new business model begins like any business, organism, or culture does, with a period of innovating and vigorous growth, making profits to expand its systems. When the environment responds with increasing resistance or stiffening competition, the new strategy is to choose when and how to switch from maximizing profits for growth to maximizing long-term profitability to pay it forward. That’s done by refining systems to operate in smooth harmony with each other and their world. It’s a more gradual process but would produce more integrated development and be more profitable in the end, to combine human ingenuity and natural design.
______________
Do comment if this gives you questions or ideas!
______________
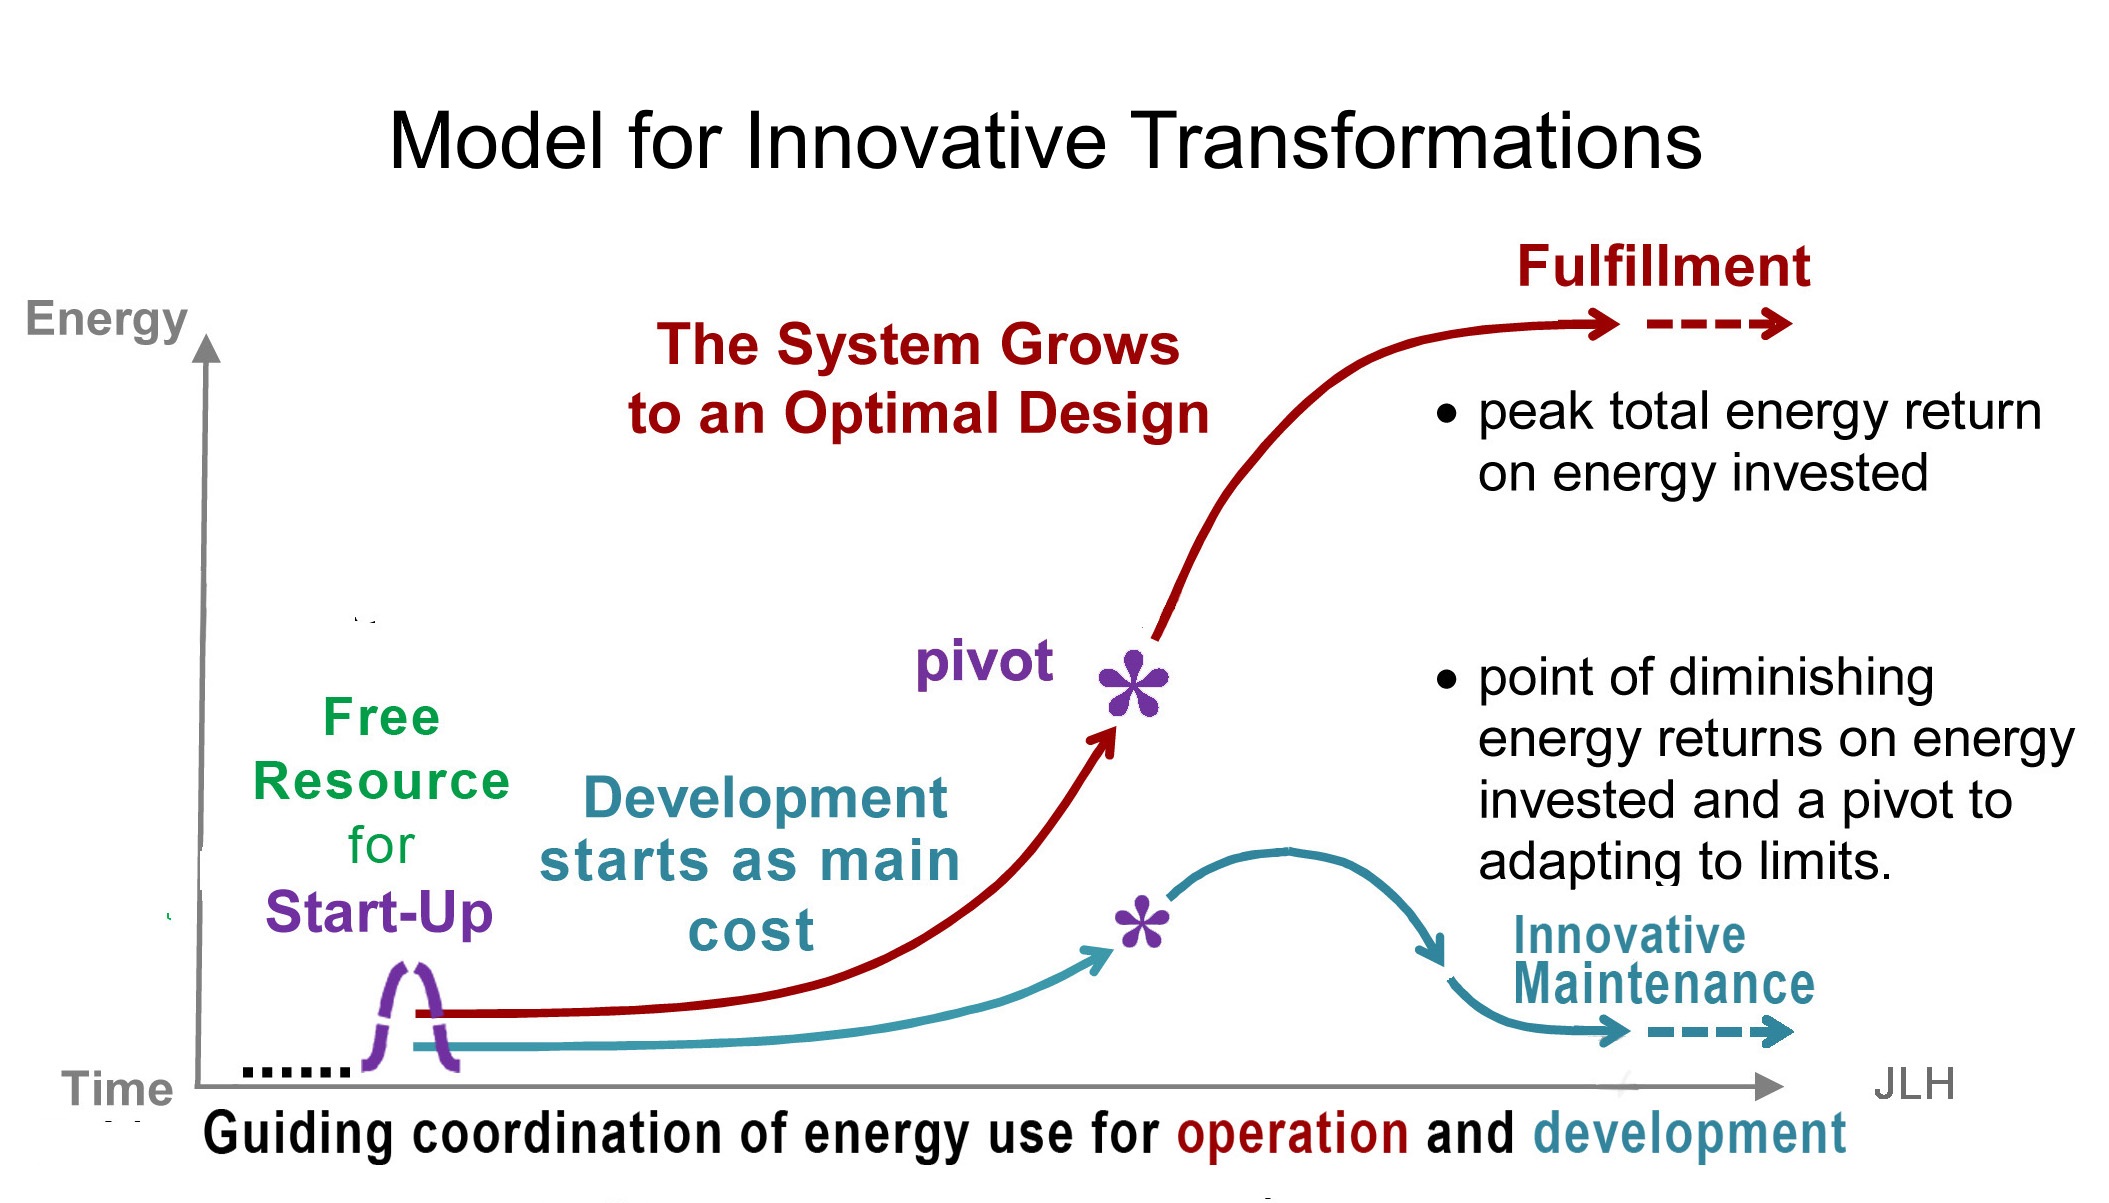
[*] Jessie Henshaw consults as HDS natural systems design science, sy@synapse9.com, offering insight into nature’s processes of negotiating change. She uses natural systems thinking strategies (NST) with “action research” (AR) and architectural “pattern language” (PL) methods of collaborative developmental design. The start is from recognizing that organizational processes in nature follow a familiar arc, beginning with bursts of innovation, and then refinement, leading to a final release (IRR). That is not unlike how we all do home or office projects, in stages of immature then maturing growth then release, also seen in reproduction. The system produced is first “framed out” with innovations then “filled in” with refinements and “delivered” as the release when ready. Her current related research article is on how our Systems Thinking co-evolvolves with our Systems Making.
The Growing Effort to Decouple GDP from Energy use and CO2, is having no apparent effect, raising serious questions about the nature of our plan.
The graph below (Figure 1) shows the 46-year record of world GDP PPP, Energy, and CO2, during which their growth rates have been in constant proportion to each other, called their “coupling.” The things to read are 1) the lack of accumulative departure from the steady trends, and 2) how closely the exponential trend lines (dotted) follow the data.
It shows that the long trend still holds despite both big efforts and bigger promises that accelerating growth using more efficient processes would separate the expanding economy from its impacts. Focusing so much on the “positive” completely disguised the big picture, though, that in 46 years there has been no accumulative effect at all. So there’s a lot to explain, yes, but the graphs below show persistent regular behaviors of the economy as a whole resilient system, a problem not yet faced at all.
Figure 1. Coupled Growth Trends of World GDP, Energy & CO2, showing how the three move together at proportional growth rates, as parts of a whole system.
That energy use and CO2 emissions are now still growing at the same rate as 40 years ago is strong evidence that none of the sustainability measures such as exceptional efficiency gains said to decouple the economy from its impacts, have had any effect at all.
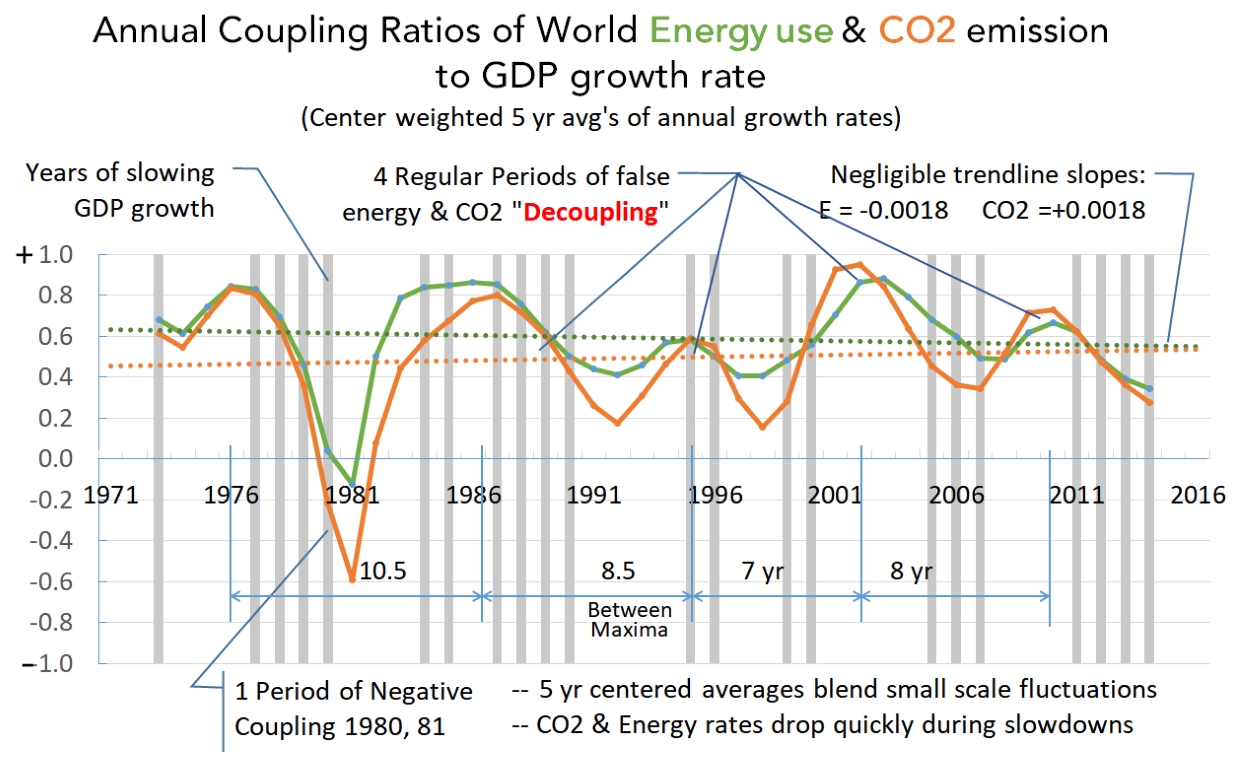
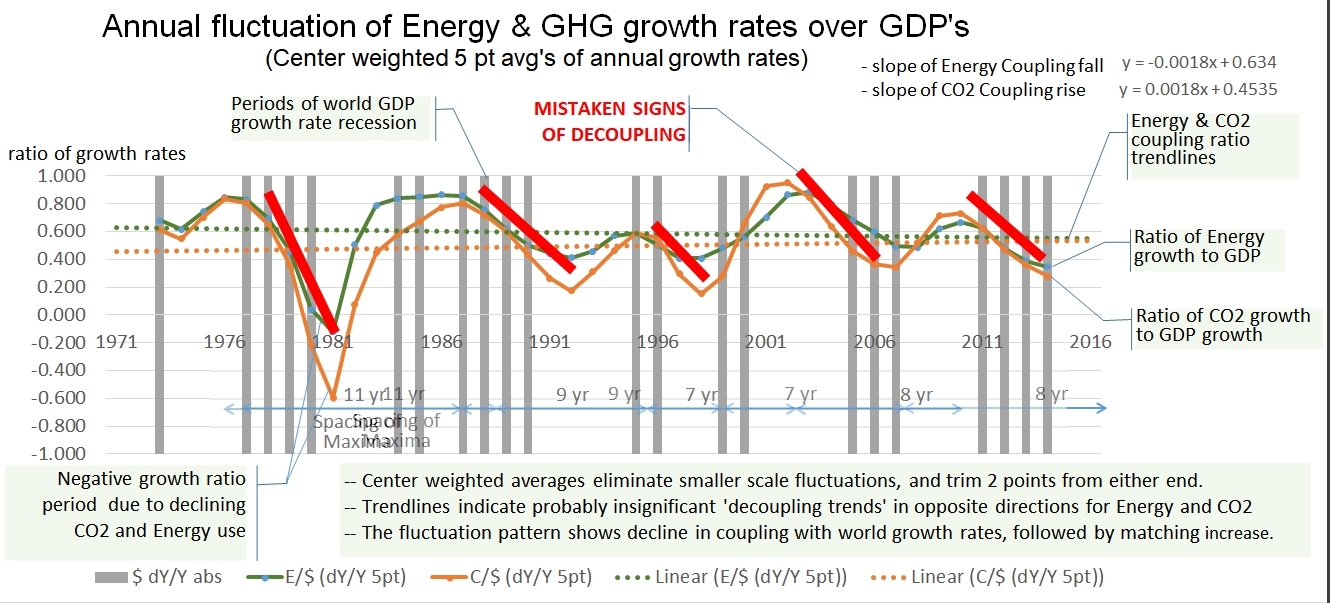
The irregularly fluctuating curves below (Figure 2) show the annual rates of coupling if world Energy and CO2 growth rates to World GDP (PPP). The scale at the left shows their locally averaged growth rates as a fraction of the locally averaged GDP growth rates (to somewhat smooth the curves) going below zero once. The important thing is to notice is that the fluctuations vary around nearly horizontal trendlines.
It’s as if the economy is guided by an “invisible hand” keeping the fluctuations symmetric to the near constant trend. It says the fluctuations have been adding up to no effect. The likely cause of this is how a competitive economy naturally works. Technology and resources are supposed to be treated as being fungible assets, to be constantly reallocated to maximize profits. In the data, that functional coupling between the physical and financial systems of the economy is shown working rather smoothly, replacing less with more profitable assets to maximize the growth of profits for the whole. That stable coupling of managed assets to growth is then an apparent natural emergent property of the system as a whole, as a partnership between human cultures and the financial world’s effort to maximize growing profits.
Figure 2. Regular fluctuations of Energy and CO2 coupling with GDP, have repeatedly been claimed to be evidence of rapid decoupling… ignoring how very regularly the periods of apparent decline were followed promptly by reversals, as if irregular waves of water seeking the average level.
How the world community came to say that “sustainable development” would reverse this stable natural relationship between the economy and its resource uses is described in more detail in April 2014 in The Decoupling Puzzle. Small fluctuations do keep causing excitement for both devoted climate deniers and sustainability advocates, though, each picking out brief trends seeming to affirm their hopes, like the five periods of apparent rapid decline in CO2 to GDP coupling shown here. The real evidence is that the local fluctuations never seem to result in a change in the direction of the whole, like ripples on a pond that always level out. The latest dip in the CO2 coupling trend has been claimed as a sign of turning the corner by the IEA, clearly unaware of the consistent pattern of that metric repeatedly fluctuating around a near-zero trend.
Added perspective on the global data is gained by plotting the ratio of GDP to Economic Energy energy, the amount of wealth produced with a unit of energy. We call that variable “Economic Energy Efficiency,” the amount of economic wealth generated per unit of energy. Having its growth rate = 1/3 the GDP rate implying that improving efficiency contributes 1/3 of the value of energy to the world economy, growing Energy use contributing 2/3 if the value. That ratio demonstrates a general case of Jevons famous observation that in a growth economy efficiency results in growing rather than declining resource use and impacts. Any way one reasons it, what is crystal clear is that in the last 46 years strenuous effort to use efficiency for sustainability have had the opposite of the intended effect, recreating the original problem rather than solving it.
Figure 3 The share of GDP growth contributed by Economic Energy Efficiency proves Jevons principle that in a growth economy efficiency multiplies energy use and all its accumulative earth impacts.
So we need to be suspicious of the world policy to maximize growth at any cost. The costs are rapidly swelling not shrinking. The other coupled impacts of growth also causing how people live being forced to change ever faster creating major disruptions and dissension all over the world is one of the biggest, though even the NGOs are very slow in recognizing. In nature, growth is how all kinds of natural systems begin, but those we admire for their perfection turn to refining their designs before they climax rather than, driving their growth to the point of being torn apart of being exhausted.
That’s the trick. Maximizing growth might seem logical as a way for societies to keep up with social distress and debts, but now it’s accelerating them. So now we need to balance the attraction of short-term profits and connect them all the unbalanced disruptive changes that now surround us. We talk lightly about replacing people with robots, for example, overlooking that the robots only work for the banks. That’ll make people and governments ever more indebted and incapable of responding to climate change, for one problem. And that chain of consequences goes on and on, that is as long as we keep ignoring how natural growth systems that avoid the problem work. More disruption is not the solution, only moderation.
There’s an alternative business model that could serve as a general design for growth without disruption, one that switches to paying the profits forward once any debts have been paid back. Once understood, that is what would achieve truly integrated, thriving and self-limiting development, as biomimicry of ecosystem designs. It is discussed in more detail in the article linked from my next post, Culture, Finance-for-Development, and tPPPs.
Use biomimicry for how nature uses growth to build thriving and enduring systems.
It would be a way for businesses large or small to begin to experiment with how nature succeeds in creating beautiful, thriving, and purposeful systems. It’s a fairly simple formula. It’s also a practice we all know well for how to successfully relate to other people and how to successfully complete business or home projects. It starts with building up innovations to then select what to refine for making the result resilient and purposeful in its environment. If we approached every new relation or project by piling on new experiments with no turn toward refining something to last in the end, all the effort would go to waste in the end.
To start you study the similarity between nature’s way of building things to perfection and how we do our own home or office projects! They all take place in “three acts.” The first act is for “innovating,“ the second for “refining,“ and the third act the “release” of the finished product into its waiting environment (IRR). You see the same three acts in the birth cycle, and in the start-up of new businesses too, as well as the formation of new cultures and most every other kind of individual development. The trick is really to pay attention to the inspiration that starts it off, as something to fulfill. That lets you anticipate and move smoothly between the stages of emerging development, first adding up more innovations, then refining the ones worth keeping to the end. It’s what comes most naturally when we can see the whole effect.
_________________
When you can see the whole it’s easy to recognize the point when adding more innovations begins to work against getting something finished, called a “point of diminishing marginal returns.” Of course on a home or office project what tells you it’s time to shift to finishing what you started is just sensing what can you finish while you have time and resources. For anything measurable, like wealth, the point of diminishing marginal returns is when it becomes more profitable to put efforts into getting things to market rather than try more experiments. To apply it to the world all you do is ask: “What is our real plan here?” and look around for how to perfect what we started, and at the right time stop taking on more and more that we probably won’t be able to finish. It’s a matter of shifting to pursuing achievable goals rather than hanging on to thinking ever bigger with no end in sight. Reaching for the right goal doesn’t necessarily make the work easy, of course, particularly for big personal, community or business projects. It just makes the work a lot better, and the end something fulfilling and rewarding.
I discuss that as a way to measure truly lasting success for the UN’s 2030 Agenda and its Sustainable Development Goals, instead of just “more, faster” the ways the UN’s goals are like the goals of business-as-usual, discussed in more detail in Culture, Finance-for-Development and PPPs.
JLH
Analysis Notes:
The global GDP PPP curves show IEA data from 1971 to 2008 spliced to overlapping World Bank Data from 1990 to 2016. The curves for global Energy are from BP statistics, and the Global CO2 curves show data from WRI.
The Energy and CO2 curves were each scaled to the GDP curves in proportion to their average growth rates for a graphically clear and honest comparison.
dy/Y is the ratio of the change in a measure over the total, like an interest rate or growth rate measures. I get smoother curves by blending a bit, using a center-weighted 5 point bracket.
“A fiduciary is someone who has undertaken to act for and on behalf of another in a particular matter in circumstances which give rise to a relationship of trust and confidence.[1]”
“A fiduciary duty[2] is the highest standard of care at either equity or law.”
– The wide implications relations based on fiduciary trust – JLH
Professionals making decisions for others have a duty to act in the client’s best interests, to the best of the fiduciary’s ability, as the basis of trusting the fiduciary’s services.
The law doesn’t limit “best interests” of others to short term financial gain, leaving open all other interests everyone has a right to, such as not being misled, living sustainably, respecting due process and receiving justice.
What has changed in the modern world is that we face more threats and know more about them, so now we can hold our professionals responsible, demanding our universal human interests be respected as their fiduciary duty.
Putting this on the human rights agenda would only take talking and writing about it.
– Current Law: The Fiduciary Duty for investors[i]
“Whenever you are dealing with someone to whom you will entrust your money, such as a registered investment adviser or a bank trust department, it is nice to know that, in the United States, they owe you what is known as a fiduciary duty. This is not to be taken lightly because, under the American legal system, a fiduciary duty is the highest duty owed to another person. It requires the fiduciary (the person with the obligation) to put the interest of the principal (the person to whom they owe the fiduciary duty) above their own.”
“This requirement to act in their best interest includes disclosing any conflicts of interest that may arise so they can be known ahead of time, leveling the playing field. Breaching the fiduciary duty can result in draconian punishments, including being barred from employment in certain fields, being banned from working with certain types of securities, being forced to pay significant civil and criminal penalties, the loss of employment, and, in some cases, felony conviction with accompanying jail time. To put it bluntly, the fiduciary duty has teeth.” [see source for rest of article]
“A “fiduciary duty” is required of a person who manages money, investments, or other property on behalf of another person. When the situation involves a board of directors managing a corporation, the fiduciary duty the board has to the corporation’s shareholders and investors is known as a “business duty.” A person who has a fiduciary or business duty is known as a “fiduciary.”
“A fiduciary duty requires more than the ordinary reasonable care that appears in most personal injury and tort cases. Fiduciary duties are generally split into two categories: the duty of loyalty and the duty of care. In some cases, board members may also have a duty to disclose information. They also have a duty to avoid conflicts of interest.”
“The duty of loyalty requires the person who has it to handle money with the best interests of its owner in mind. The fiduciary must put the owner’s interests before his or her own and may not profit from managing the owner’s assets without the owner’s consent.”
“In a business situation, the duty of loyalty requires the board of directors to run the corporation in the best interests of the shareholders. Directors have a duty not to let their personal interests conflict with those of the corporation.” [see source for rest of article]
Note: there is no limit to what “best interests” a fiduciary needs to serve,
1. There’s only a limit on their ability to serve them, and
2. All “best interests” would require not being misleading
A change in natural science is emerging along with “computing”
turning away from using theory & equations as a guide,
toward using data pattern recognition for
naturally occurring systems revealed in the data to be a guide.
Preface
Note: About 20 Years ago algorithms were developed for selectively extracting differentiable continuities from raw data, making a major step beyond “splines” for true mining of natural continuities from noisy data without regression. The result was quite successful forensic pattern recognition of discovered natural systems, their forms and behaviors. Combined with a general systems “pattern language” based only on the constraint of energy conservation, that pattern mining has provided a very productive alternative to AI for investigating naturally occurring forms and designs. The one unusual leap for applying scientific methods was to use it to capture the great richness of natural textures available from studying uniquely individual cases and forms found in nature. That is what overcomes the worst faults of studying individual cases, and so instead greatly enriches theory with directly observed phenomenology. The rudimentary tools successfully developed have been proven useful again and again with subjects such as illustrated below. 10/21/16
_________________________
A long central principle of modern science, relying on defining nature with the information we can find, is considered here by way of eight examples of how important it is for science to also rely on doing the opposite, looking for patterns in the information we are missing somehow. Doing much the reverse lets us use the information we have to ask better questions about what nature is hiding from us.
It’s such an odd and obvious mistake to stubbornly treat nature as our data, as Neils Bohr and Popper insisted on and the QM community has maintained. Being limited to analysis and data creates a large blind spot for science, made unable by that limitation to learn from observation, and to see clearly how very different the “data world” (what fits in a computer) is from the “material world” (what doesn’t). The puzzles of found in natural patterns, turning up in ‘bigdata and various pattern sciences seems to be putting all of these matters into question again.
So I may take some unfair advantage, perhaps, by making a little fun of that prior arbitrary constraint on scientific inquiry, insisting that nothing we have no data for can exist. That of course is almost everything when it comes down to. It’s no joke, though, that our data is decidedly inferior for defining nature. Here and elsewhere I tend to allow that nature defines itself, as I certainly don’t do it.
The “Impacts Uncounted” article mentioned describes a simply enormous worldwide neglect in economic accounting, a huge mismeasure of lasting business environmental impacts. It’s caused by the traditional insistence on trusting the data at hand and refusal to look for what data is going uncounted, as if the fact that we can only study the data we have means nature is not being misrepresented by it, a curiously deep concern for understanding the scientific method. In reality there is more to life than the data we have. Treating “science” as whatever our data defines, then, actually means “flying blind” regarding all the kinds and scales of phenomena going unmeasured, the difference between nature and data going unseen. For accurate accounting, even older scientific principles need to apply, such as defining units of measure in relation to the whole system or “universe” for that measure, not just the part easy to measure, and so “Impacts Uncounted” is the effect of counting the global impacts of business using local measures, as is today standard around the world, a big mistake.
So these 8 examples are “data visualizations” that neatly expose where important data is very much missing, as a guide to where to go and look. Those hiding places exposed as gaps in the data turn our attention to phenomena of perhaps another kind or another scale, or on another plane with material influence perhaps. That is then what needs to be discovered and looked into. to really understand what the measures display and the systems or events they refer to. That the data available, then, always points to phenomena beyond the scope of the data to define is both the oldest and perhaps now the newest of deep scientific principles for interpreting what we see.
Is science coming full circle…? The answer seems to be YES!
Persistent patterns in data generally reflect complex natural forms of design, complex and complicated well beyond what data can define. So we present data in a way to helps show someone what’s missing.
Data from a natural source is generally biased and incomplete as a result of how it’s collected, and a “proxy” for various things other than what it is said to measure. So not really knowing what it measures, it is best studied as being another way of sampling an undefined universe, to become meaningful by discovering its boundaries
Patrick Ball’s HRDAG[1] methods demonstrate comparing sources for death records in conflict environments, using the differences and overlaps to reveal the true totals. My own research shows environmental impacts of business are undefined, lacking a common denominator to make them comparable as shares of the same universe. Correcting the mismeasure appears to increase the impact scale of business by several orders of magnitude[2]. In both cases characterizing the universe the original data is implicitly sampled from serves as common denominator for making the original data meaningful.
For discussing basic explanatory principles of physics used for forensic systems research[3]
1. See where hidden connecting events shifted the flows??