It’s both sad and marvelous to now be reading the clear signs that science has become so misguided that only a scientific revolution will keep it from destroying all of what science built. Science has indeed shown us the great beauty of nature and our lives, given us marvelous tools for self-expression, and then also highly unbalanced ways of life now an existential threat to the only living planet we’ll ever know, not to mention threatening to the glorious diversity of human cultures made possible by the blind multiplication of our power to interfere with nature that science enabled and made science so profitable.
One of many bits of clear evidence is the scientific consensus that global warming is caused by our overuse of fossil fuels. Technically, that is a symptom, not at all close to the cause, but aside from that, the consensus scientific response to the symptom is to try overusing something else to replace fossil fuels to see if that works out any better.
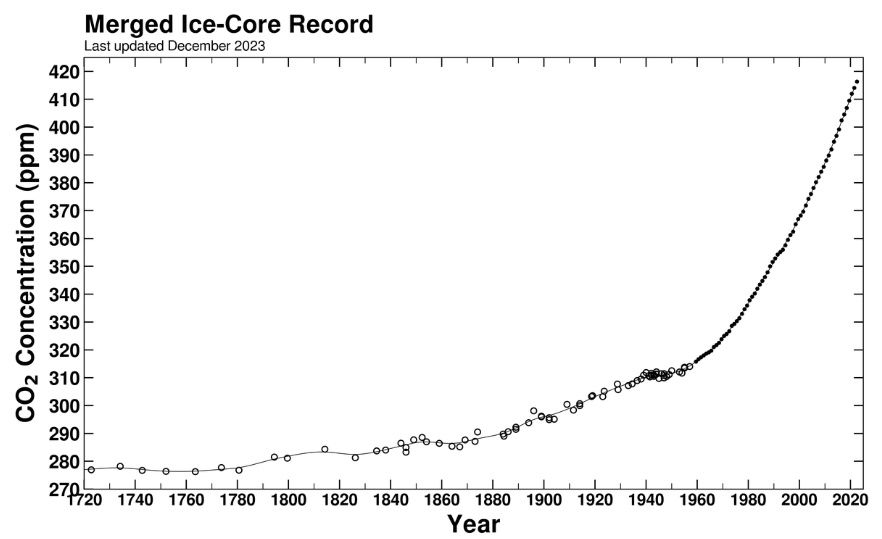
Or, you could ask, “How’s this for progress?” This December 2023 data record of the entire history of human-caused CO2 blanketing the earth shows the accelerating acceleration of the climate-forcing trend. Its real value, though, is as remarkably clear evidence that **all our solutions are only accelerating the problem.** You could hardly find a greater or clearer cry in the darkness for a new scientific revolution. Clearly our guidance is way off track.
We’ve faced profound contradictions produced by science generation after generation, most not timely nor effectively responded to, some wonderfully enlightening too, and of both the larger and smaller varieties of important confrontations between our minds and nature.
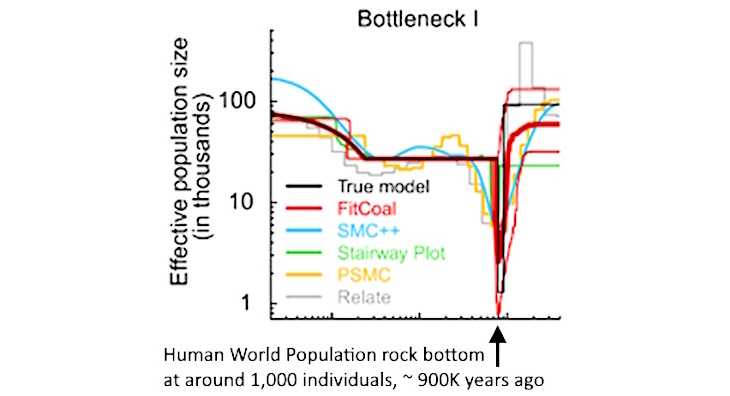
Perhaps going back to the origin of the human species about 850,000 years ago when our peculiar constellation of amazingly perfected designs, our ultimate problem seems to be whatever caused us to be emotionally attached to making up our own realities, given minds and bodies that proved very clearly our sudden emergence back then marked a major departure from evolution.
In this story, the rub is that in order for humans to make mental images powerful for influencing our far more complex and varied environments, we clearly had to keep perfecting our ideas and tools and selecting the most powerful for controlling outcomes as we evolved. Given the vast “mismatch in variety” between mind and nature, we’d have to keep leaving out more and more and more of the contextual variation of reality to fashion ideas, giving us more and more power, not noticing that it also divorced us from the contexts from which all other kinds of meaning come.
Thus, we came to represent nature with numbers and formulas, ENTIRELY stripping our images of nature from their contexts. That separation of our powers from the wide and rich variety of the contexts of natural working relationships was the cost. Our mental versions of nature then harmonized our blind power over nature with the warm connections of home and family, the one place in our world, the foundation of our cultural worlds. Coupling our mental worlds, centered around in-context relationships but increasingly dominated by finding abstract rules, taken out of context, selected for power over things over the centuries, is the storyline of our whole history, enriching and impoverishing our chosen way of living, then becoming trapped in using science to multiply our interference with nature for profit, that the math all projects to be potentially infinite. … well, something wrong with the math – no context.
History is replete with all manner of stories about the disastrous course of affairs that lead to, like the story of Adam and Eve or how the most successful civilizations tended to collapse, the rub being that the problem-solving gets too complicated, as documented by Joe Tainter. The familiar fables and famous plays centered on the naturally corrupting influence of power over people and nature are evidence, too. The cause? The cause, apparently, is the oversimplification of the rules of power and the blinding of the people using them to the contexts in which they are being used.
So …. that’s something of a big deal. Humans are also capable of big ideas as well, though, and it’s clear today we may have only one chance left to get the idea out of our heads that the laws of nature are what we think. Could our way of thinking change to being part of the world we live in and came from instead of being in charge of it? Sure, it is very possible. If you learn to read the markers of the difference, you find the diversity and learnability of ways for people to reconnect with the natural world and possibly continue our, in some ways, most remarkable of nature’s great experiments, are growing all over.
What’s in the way is the power of our few hundred years of perfecting our powers, unaware of how ultimately dangerous to ourselves and to life it made our dominant world culture. My most recent contribution to that is in the form of a LinkedIn post yesterday (to celebrate my birthday! :-) on how my views evolved. I come from a multi-generation science and education family and had a marvelous connection with gamey high-school friends and relations who got together in Brooklyn in 1968 to collectively ponder what in the world was happening to us and have fun doing it.
I’m a natural systems transformation scientist, who was mostly learning from the UN SDG process in the early years and looking for words to describe what I saw happening. There are some flaws in the design the UN produced, all preapproved by finance, that prevented the SDG process from being more effective. There are also ways in which it was intentionally or blindly designed to fail; driving BAU and our world’s existential crisis. but deep look under the hood finds something quite positive.
This is a message first sent the UN’s Major Groups on strategy for the upcoming SDG Summit, on the ten year anniversary of the SDGs, as it struggles with the world spinning ever further out of control despite the enormous effort to reverse the pattern.
Intro to the MGs: It’s been a very pleasant honor to engage in NGO MGoS meetings again this week, feeling the energy building to do something significant this fall (just around the corner). In the workshop at the Church Center yesterday I got some very reassuring responses to suggesting we finally look at the main causes (where the leverage lies) regarding the threats we’re responding to, and, to having “nature on the board” of the MGoS and maybe the UN too.
__________________________________
The main thing I found, though, is that we’re not learning from the diversity of examples of how nature elegantly solves growth overshoot problems like ours. There are good models of all sorts to help us see the turns to take. It’s a matter of responding in time to care for what we create. The fortunes of a starting plan, of “multiplying new forms,” switch in the middle to “making them work” in context. At first, growth is centered on what got it started, then naturally collides with the world it grows into. That involves steering. We do it quite successfully all the time when we see what’s happening, as when making dinner, making friends, or starting a business, noting when multiplying initial successes turns to a need to make them work in context.
To me, the greatest achievement of the SDGs is the great wave of caring about what happens to us it helped trigger. We’ve been talking about why that seems not the main interest of the many institutions that are supposed to serve us. That may be natural at the end of growth. An emerging wave of caring for the whole of a new system, as a unity of parts, seems to be the first sign of it developing a survival instinct. It seems to come with the shock of starting to collide with its environment when new lives most often also need the most care as they struggle with their new reality.
So, other than nature, what’s the real root cause of our troubles, and why hasn’t humanity readily responded in its own self-interest? It seems to be what has bothered the now dominant culture forever, that it learned to communicate powerful ideas with words and numbers, that kept going out of control and separated us from nature. Using words and numbers for steering our choices is dangerous. Both easily misinterpret and misrepresent the realities they are abstracted from. So fears and misunderstandings of what we’re doing can amplify and allow us to create and need to rely on entirely unreliable life support systems, as ours is, based on multiplying power. One could spin it saying that people blinded by power found it simpler to creatively overpower parts of society and nature to solve their problems, making bigger and bigger problems. Another way to see it is as one of those “experiments” that nature wanted to try out on us… just to see what we’d do, and if we’d ever grow up. Nature IS very experimental, after all!
“The cure” seems to be to unblind ourselves, rediscovering how our world works by reattaching our abstractions to their real meanings. We’d more carefully explore, experience, and validate our thinking, “regenerating” the tried-and-true ways of steering our lives that all of life has depended on from the start. Without much notice, the systems scientist Elinor Ostrom received the Nobel Prize in economics in 2009 for the essence of that plan. Rather than using powerful and blind abstractions for remote controlling nature, we’d explore our contexts to enrich and inform our senses, notice and respond to changing opportunities, and draw on honest feelings, fears, and other intuitions to help us understand what’s going on in the non-verbal world, and develop indicators for where our externalities are and include them in making our decisions.
So, is this our best chance to put nature back on the board? The main threats from not consulting her seem to be: 1. Global societal degeneration and threatened authoritarian takeovers. 2. Financial institutions taking the job of defining the rules of “sustainability” to a. blame producers for what they’re told and paid to maximize for finance. b. holding themselves blameless for the multiplying externalities to be ignored.
JM Keynes seems to have been the first to say it. We should find some better uses for our money. Will it be to care for our world, to destroy it, or go endlessly back and forth?
_______________________________________________
What do you think?
We’re clearly in the biggest jam our species has ever faced, with our cure for climate change accelerating it, the latest curve, below, clearly showing that we have had ever faster accelerating climiate change since WWII, and the curve is very smoothly optimized, apparently by the financial system believing that maximizing the the steady explosion of profits would outweigh the exploding costs of the damage, apparently not having looked at that either..?:
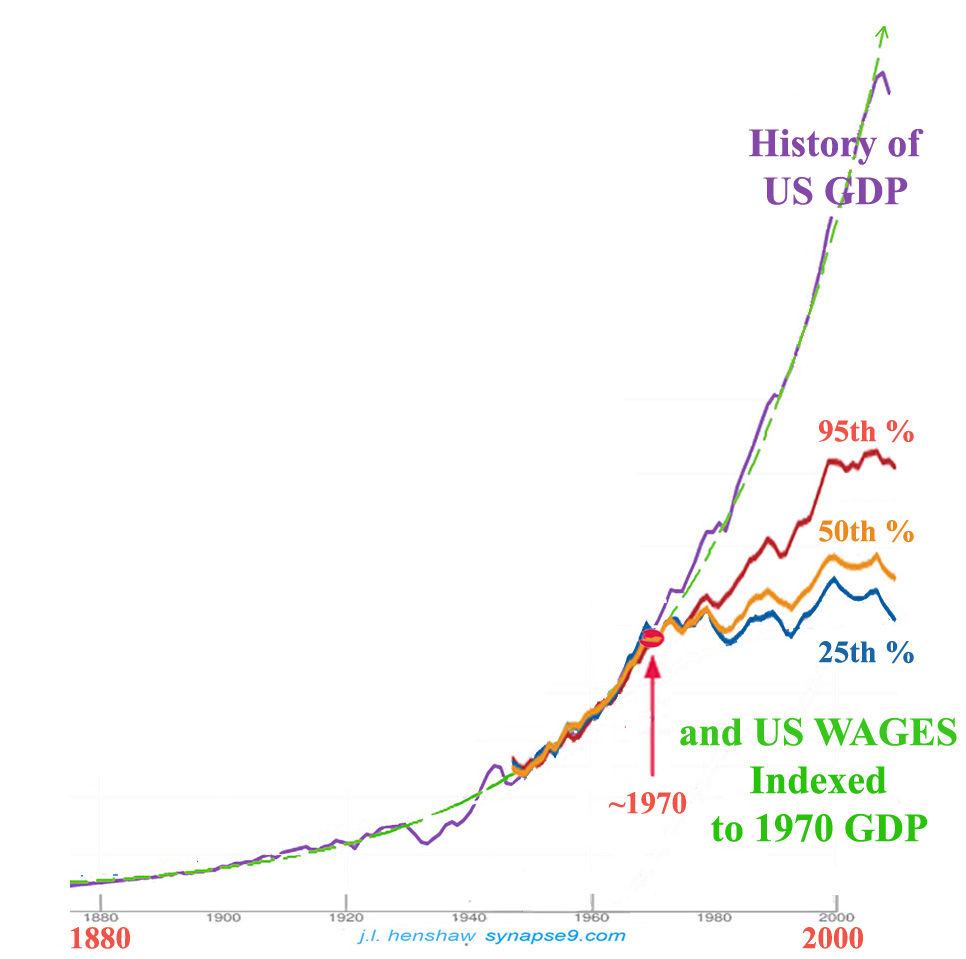
Our solution for inequality rapidly accelerated it too, apparently for some reason not studied as well.
I guess everyone was convinced that growing the pie (without counting the disruption of nature) would be best for them even though it would become worst for everyone, as the separation accelerated and the brutal consequences of disrupting the working contexts of life around the globe mounted:
It was the grand display of data driven growth maximization after WWII that did it
and … famous for failing to get out of its biggest jams, plagued by self-corruption, self-deception and extraordinary tragidy, with mumerous whole civilization collapses ‘under belts,’ only to do it again. That’s a remarkably odd behavior for a natural species, isn’t it?
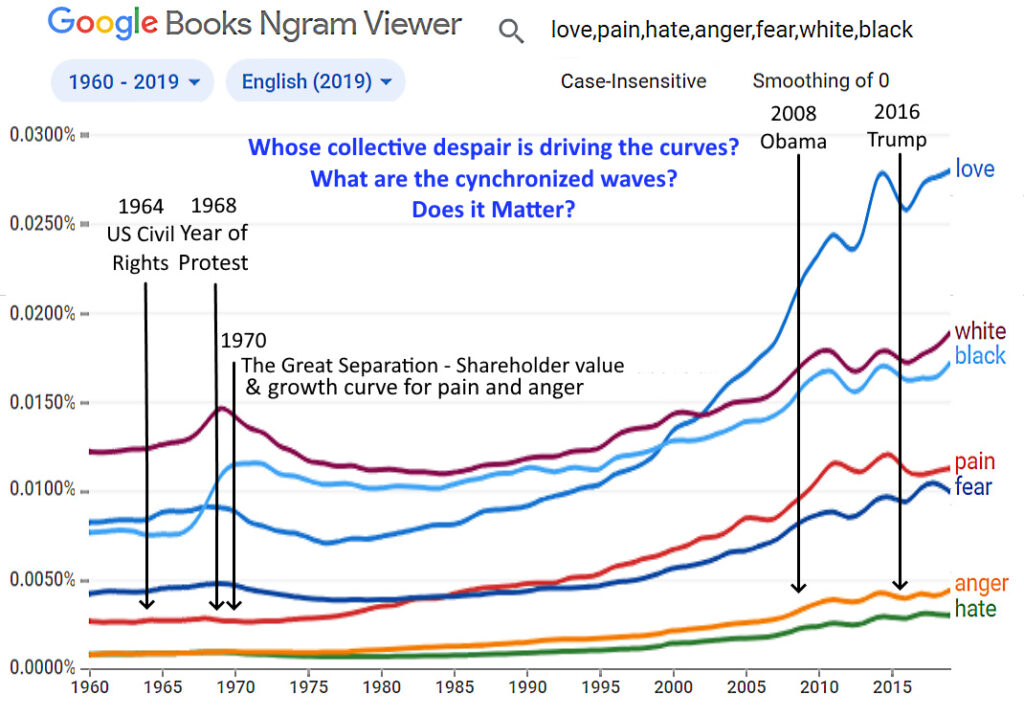
It may be the backstory to the imminent we all feel, that there seems to be a hidden center of pain being felt in some communities. One chart is of the rapidly increasing use of some very common terms for personal despair, measured by their frequency in English books scanned by Google.
The terms were picked for having curves “moving together as a group”, and include ‘love’ as one of the linked terms. Dynamic changes moving and fluctuating together as these do means they are part of one conversation, one culture, one community, all becoming increasingly desperate over time, and acting as a whole. If we consider them to be indicators of societal distress, the increases are from 200% to 400%. Who IS experiencing all that pain, is the question?? What’s happening??
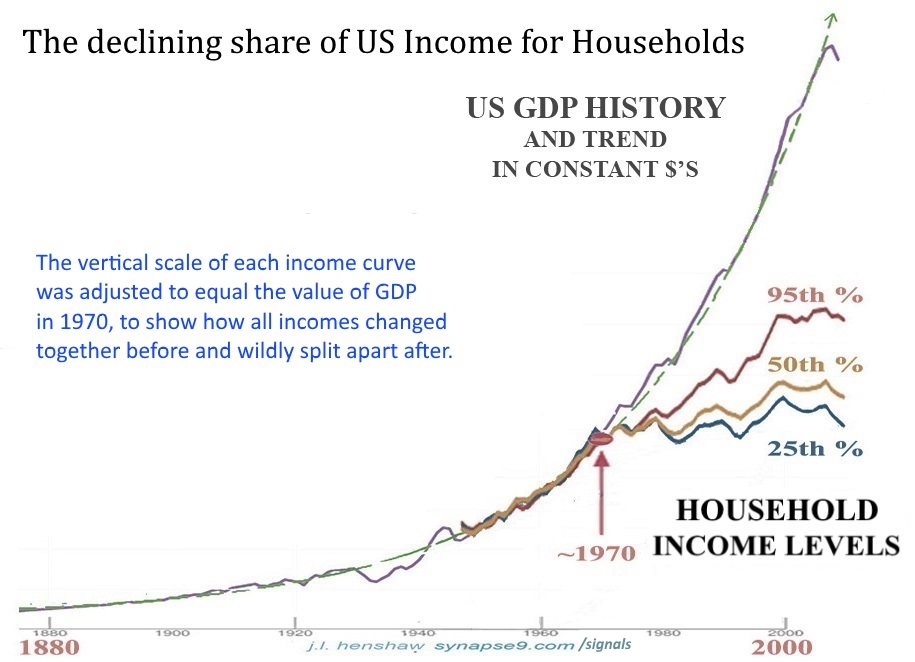
The other chart we know a little better. It’s for the historic explosion of inequality in average US family incomes that began in ~1970. It represents an exploding loss of power for almost everyone, but oddly… seeming to MAKE US ALL AMONG THE POWERLESS. That growing inequality is connected with the imposition of shareholder value as the purpose of wealth, which has driven increasingly rapid disinvestment in skilled labor in an already very challenging productivity-driven society. A brief write-up is here: https://synapse9.com/signals/was-shareholder-value-what-did-it/
AVERAGE FAMILY INCOMES GREW AT THE SAME RATE AS GDP BEFORE 1970, then began to rapidly diverge, as people became increasingly powerless.
But the real questions are: WHAT IS the unified culture most feeling this apparent explosion of pain?? How else could we show the connection between two dramatic changes in societal cultures we are in the middle of?? AND Would that tell us anything about how to relieve it??
AND OF COURSE: Does it matter?? Are perhaps the big fluctuations since 2008 those of a boiling kettle ready to blow?? Are they instead indicating pressure relief, and now letting off steam?? Or something else??
AND: Why is LOVE so regularly growing along with the pains?? Who is this really happening to, anyway?? Wouldn’t it have to be a big enough cohesive group to move the average word uses of the entire language?? AND: why is it NOT the people that I know??
What do you think?
____________________________________
That’s it. Just some interesting questions. – Note: This also shows how useful a “natural systems method” of finding nature’s stories in dynamic change can be. A new paper preprint on it is at: https://synapse9.com/_ISSS-22/MS-HNS1-Design&Steering.pdf.
I really like the idea of “Thrutopias: clear, engaging routes through to a world we’d all be proud to bequeath to future generations.” I thought some might benefit from a natural systems view of nature’s primary “thrutopia” (how growth makes it through to life) for the crises that all kinds of growth systems face. Perhaps check my recent research and writing and get in touch if you have questions. I generally don’t charge if I can fit it in.
Nature has one primary strategy for carrying emerging new systems through a whole system growth crisis such as our civilization faces at present. A growth crisis comes naturally for every growth system, as growth starts as a fixed design for multiplying the new system’s power and runs into trouble. Whether it is more or less severe depends on whether there is a good response. The crisis develops as its initial period of free exponential expansion begins to multiply internal and external pressures and conflicts instead. That threatens the system and its environment. Think of a personal relationship as a model. It develops freely and marvelously until some conflict appears, and the response to it determines the fate of the relationship and its environment.
It is quite surprising that this simple and obvious feature of how natural systems develop did not attract the attention of the leading sciences, apparently just believing some other story.
Telling it a story of nature managing the birth of new lives would fit a story arc of nature first promising new lives a gift much too good to be true, but that is true for a while. That confusing signal is part of the trouble. Nature knows all along that the initial gift is one to be taken away and for it to be unexpected for inattentive new lives. Then to select some for the gift of lasting life, nature gives ever new life a warning. Then she rewards those that change their fixed designs for maximum growth to adaptive growth and engagement with the world around them. That then stands as “the door to life,” an act of a new system choosing live, nature having gotten things started and leaving it up to new entities to switch to becoming internally adaptive and externally engaging.
You notice that I shifting back and forth between scientific and familiar discussion. It comes from my starting as a scientist and studying how language developed from people coining words and expressions to convey their experience with natural systems… ! So we have a natural systems language too.
It’s fairly easy to begin to study these transformations from familiar examples. Any of the many things we do or that happen in a day combine those startup and transformation stages. For example, the startup phase of tasks, projects, businesses, or relationships is always some natural or personal “urge to create.” If all goes well, that expansive growth follows for a bit, then at the right time, a turn toward making it a success by the system becoming adaptive to internal and external needs so it can live in its world.
The levels of growth activity in an emerging system’s life
Technically that first follows a design principle of maximizing power (called MPP) and then one for maximizing resilience (called MRP). The growth of the new system then climaxes at its peak of capability, resilience, and endurance. That change comes from the system changing its internal rule for how it invests its resources, going from multiplying its power to making it work by serving needs, including the needs of the system and the parts.
As one studies how these startup and resolution stages proceed in personally familiar cases you will find new ways of describing how it happens. That makes it easier to imagine how we could tell stories about the challenge before our world civilization, and people thrilled with it and lost and confused by it. The pattern to study and anchor other observations is that initial urge to create then accelerating activity followed by an urge to make it work and a climax with perfecting touches.
It’s wonderful to have so much movement in the movement now, the passion and connections making such awakening waves around facing our global crisis of growing crises. Capitalism isn’t amenable to the kinds of change mostly offered, moral suasion, that I hear voiced by the great host of determined voices rising in response.
The people actually most responsible are the class of highly educated successful professionals from good families ruling the world. We need to study ironies like that, looked at as non-verbal cues from nature to look more deeply at the problem. Another irony is that the educated professional class running the world, who like everyone else, exhibits highly successful survival instincts in their personal environments, evidently also seems to think nothing of destroying the home of nature and humanity at ever-accelerating rates; another irony.
The many ironies surrounding our escalating world crisis all suggest some kind of profound blindness, on the part of nature’s most intelligent species. There is one that the ironies can help us pick out. One of the other ironies that have been talked about for decades now, is that it seems our solutions are the source of our problems. That is particularly clear in how you just can’t talk to people offering great temporary solutions for growing long-term problems. They’re not motivated to look for the flaws in their proud designs. That disappointing truth is pervasive throughout the world sustainability movement. For the biggest example, even the climate change effort amounts to an enormous effort to find a temporary fix that absolutely can’t last. Its aim is to phase out one ever-multiplying energy source for another, taking no (0) account of the ever-multiplying impacts of generating and using the new source for multiplying our control of nature. What we’re using the energy for is probably a bigger actual environmental problem than how we obtain it!
In short, we’re behaving like confused 2-year-olds with respect to some of our most important tasks, as we also act like grownups with respect to some others. For some reason, I started noticing these kinds of ironies a long time ago. They would just pop out at me. I noticed in first-year physics almost 60 years ago, for example, that physics does not study the parts of nature that can’t be turned into a formula! Of course, no one would listen then or ever since, though recently I may be making little bits of progress. The insight that triggered that observation came while being taught about the parts of simple behaviors that fit formulas, like a ball thrown in the air. We were not taught about the little non-linear energizing and de-energizing transients that begin and end every case of similar events.
Conceptual thinking, the identification of simple patterns in complex contexts, is I think, at the heart of our problem. We spend so much time with our concepts, observed patterns simplified and detached from our contexts. that we lose track of their contexts, that is, except for the contexts we are deeply immersed in. The one you can’t feel and the other you can, and that has EVERYTHING to do with behavior.
Thus our good survival instincts are in familiar places and we tend to lose them if all we have is abstract data. That divide also means that we naturally think our social concepts and values rule the world because they touch our emotions so directly. It tends to make the behavior of the natural and institutional systems that really run the world go largely unnoticed. The worst part… is that the simple rules of science and finance for profitably (and blindly) growing our control over our nature and each other (rules we see as detached from their contexts), then also multiply ever-faster. So, naturally, they take over the world those “powers of our minds” (for multiplying our power) are unleashed. Looking at the long history shows the scope of the dilemma. We’ve been doing that for thousands of years, over and over, blowing things up and suffering the disaster. And we are still at it today. Of course, if this like of questions helps us see the problem, maybe we can do something this time.
So what do we do? Well, I can’t say what path to take, as that will be determined by first looking for then finding the openings in our blind convictions, to breathe fresh air into them. Then the need appears to be to at least start a cure for the very heart of the problem, how our powerful concepts blind us to the world we take power over. If we could feel what’s going on around their use we would be able to read the non-verbal cues to the state of our relationships, and not be helpless. Where we don’t feel the state of our relationships we’re blind to the effects of our choices and helpless. The main example is of course our pension for multiplying money, not having any feeling for the extensive evidence that what we do with money is rapidly destroying the earth, for example, the Top 100 World Crises Growing With Growth.
The list is too much to absorb all at once, but it’s one of the healthiest things to try. https://synapse9.com/_r3ref/100CrisesTable.pdf The solution is – conceptually – simple too. Learn from the examples of how both we and nature so often steer the growth of new systems to become lasting good homes for their builders!
So we need to somehow bring feeling to the environments our conceptual thinking has isolated us from and prevented us from feeling at home. Sound good? Do you perhaps wee any openings to explore? Lots of the ones I hear about people looking into seem to me to be just the right type. It’s a diagnosis connecting the emotional and moral openings with a practical behavioral understanding of the problem that is really needed. I think that coupling is what’s missing.
After inception originates a desire, a long struggle for change follows and then a fast breakout and establishment
– To understand these best, think of examples in different circumstances from your experience, personal, business, world, or in nature.
For the transformation to an Ecological-Civilization there’s the barrier of needing to introduce people to something very new. If we study examples of how transformations happen in our memory we can find ways to convince people to explore what’s possible.
the universal stages of growth and adaptation that create new systems with lives of their own, small, medium, large, in a permissive environment.
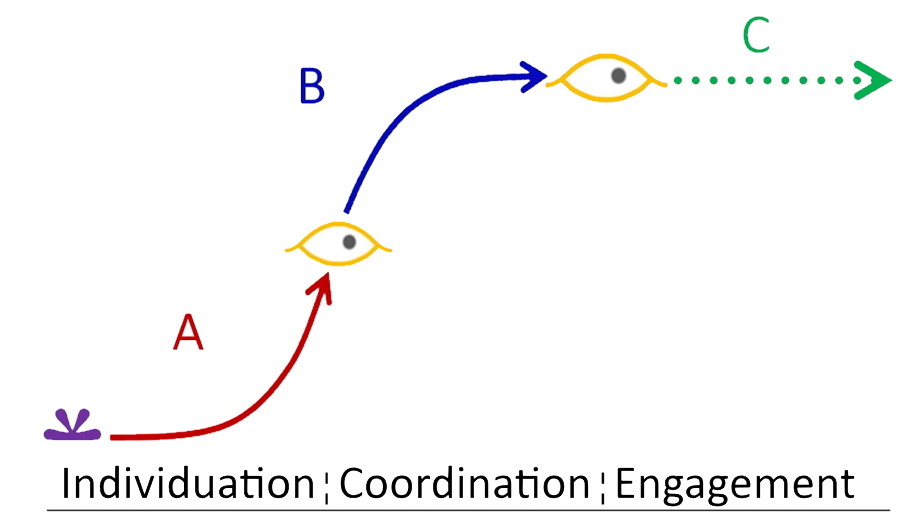
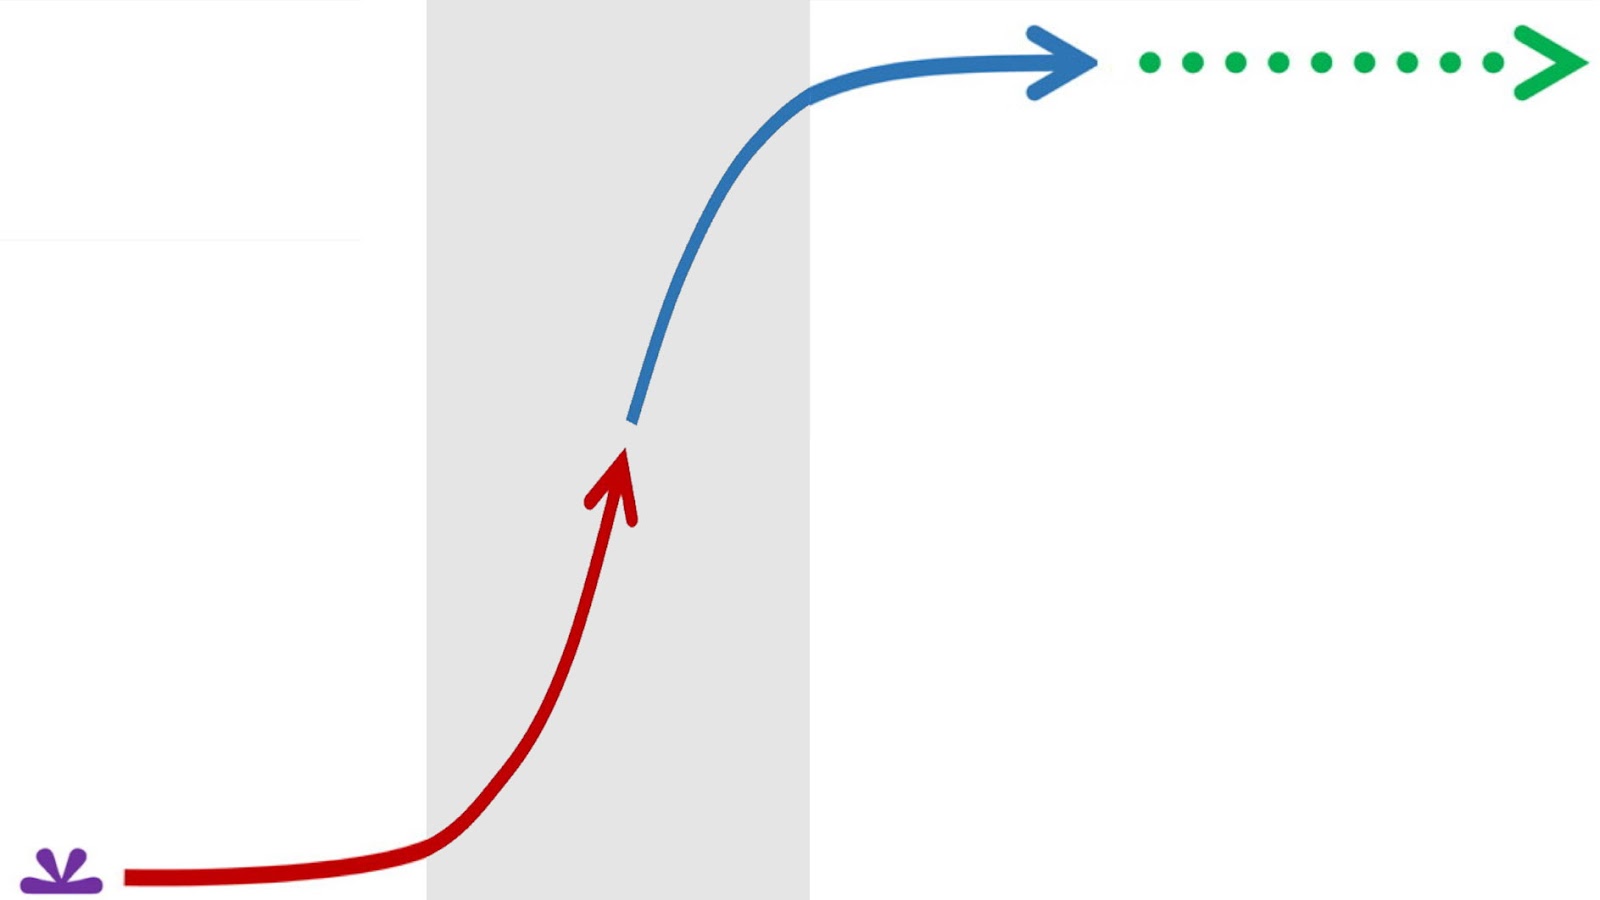
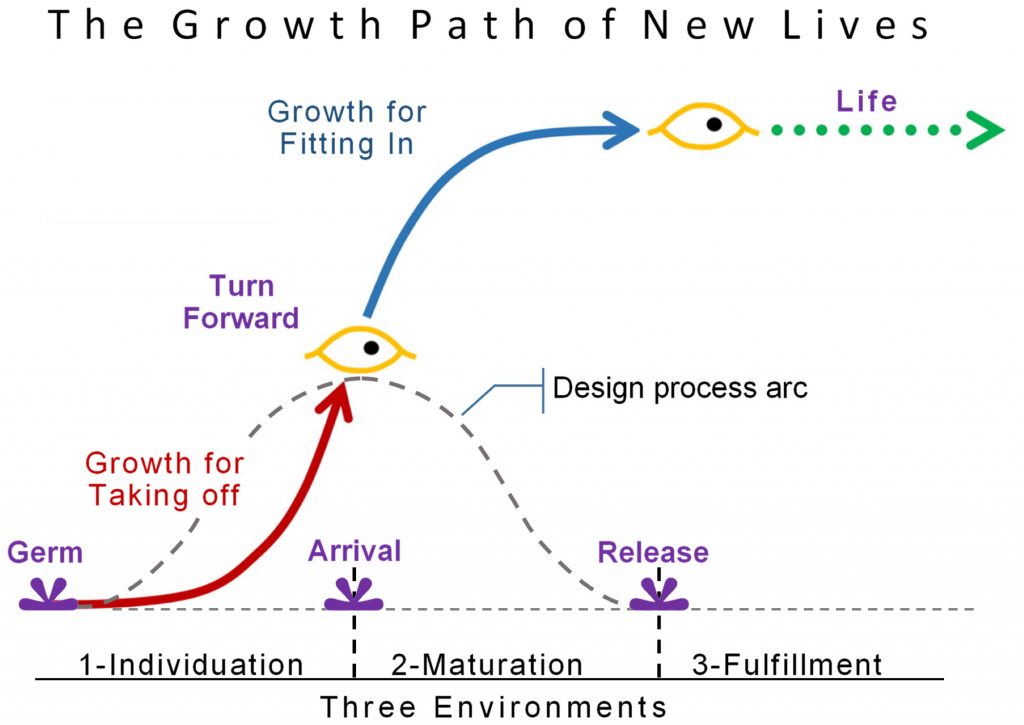
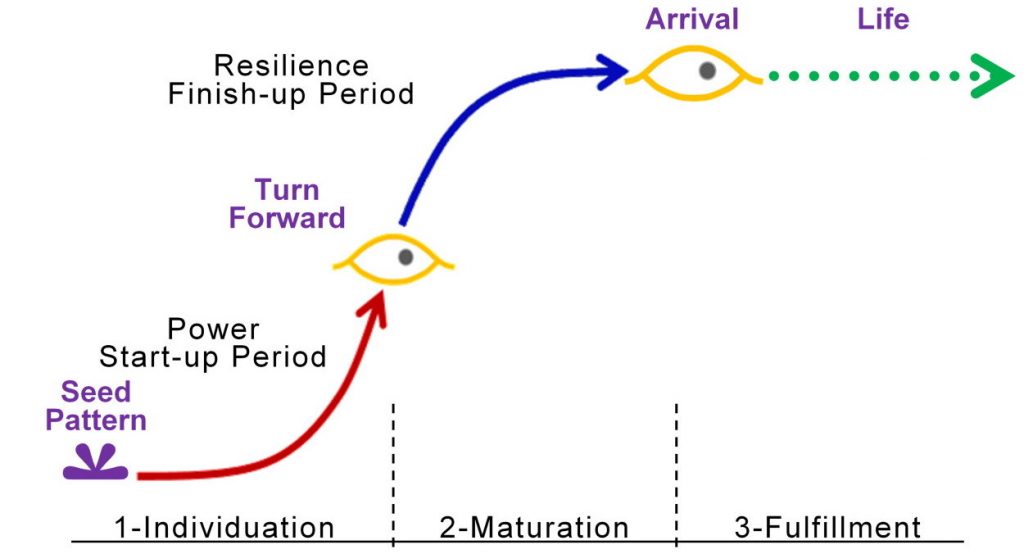
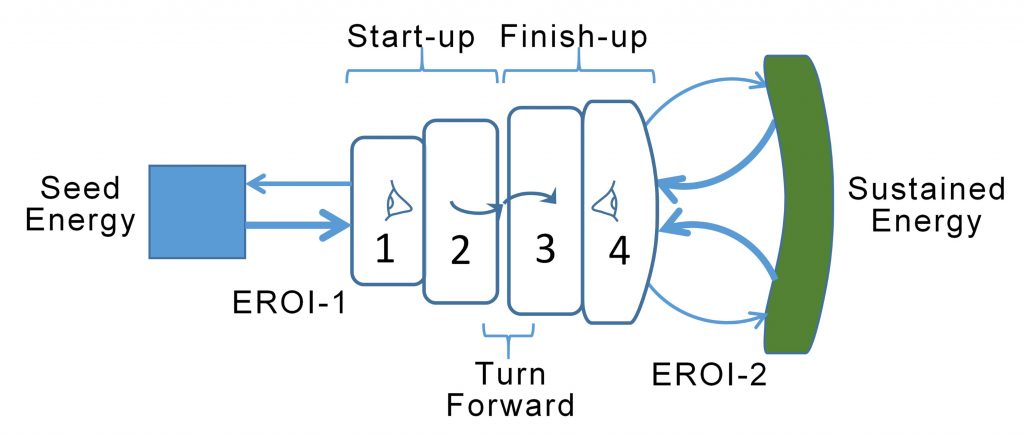
Studied carefully, it’s possible to use nature’s own method of building new systems to guide our long-term path, showing us how to move forward from growth. Stage One of new lives is the germination of a seed pattern followed by a start-up burst of development when the new life defines itself as an individual. For enterprises it’s the handshake that sets things in motion and its period of rapid growth. Stage Two is for a new life to find its lasting place, maturing as it adapts to both internal and external limitst, Arriving at it peak of vitality ready for Stage Three, its long creative life. The curves tracing this story line are highly generalized, as are the terms used, but any startup faces these challenges.
Once you get the idea it’s astounding how many kinds of familiar transformations, on all scales, follow this natural system-building process for new lives. For projects large and small we execute our plans first starting with a concept, then working it till it is ready for its climax environment, — individuation followed by maturation and fulfillment
The start of new life is a “germ,” “spark,” or “seed” pattern, a vision or a fertilized egg, that soon starts to multiply on its internal resource and organize its internal parts, usually in a very protected and forgiving environment. For a human embryo that’s its womb, for an Eco-civilization it’s the virgin earth, giving us whatever we wanted for a long long time.
Then along with a dramatic change of environment at the limit to growth, there’s a change of life — a “turn forward” to maturing to make new relationships. Like birth, the end of compound growth is a perilous change requiring a great change in relations, resources, and expectations, a big test of survival a system’s will-to-live. It’s called the “turn forward” because attention turns from extrapolating from the seed to making a mature life in the future, in a more challenging environment.
For our newborn Eco-Civilization, hitting the limits to growth comes as a complete surprise, and will take the emergence of a great will-to-live, and lots of work to pass nature’s universal test of survival for new lives. Most of the human population is still blind to the profound change at hand and thinks growth is life, and that overcoming our troubles will be like returning to the past. It won’t BE THAT AT ALL! We’re heading for mature life, which given nature’s ways could be far better.
As humans, we have distinct advantages for charting our course. We have loads of experience in giving birth to all kinds of systems and giving them lives of their own. Personal relationships are one, requiring that we follow each step in the process and making good choices about going too slow or too fast, among other things. Making dinner is another, needing to be lovingly imagined, assembled, and perfected to serve its purpose. Both home and office projects fit the model too, starting with a seed that grows and is made to fit into the world around it.
So the fact that large systems go through much the same birthing process as small systems is a new discovery. To manage the end of growth for our Eco-civilization will call for all our personal wisdom for what’s right to help us understand what’s too slow and too fast, among other things, for the transition to an Eco-Civilization.
It will also have to do with money, so tied up in driving what seems like a growth imperative for civilization to operate, but is really just a choice of what to invest in. And now we need to invest in better things, like #FAIR_Money.
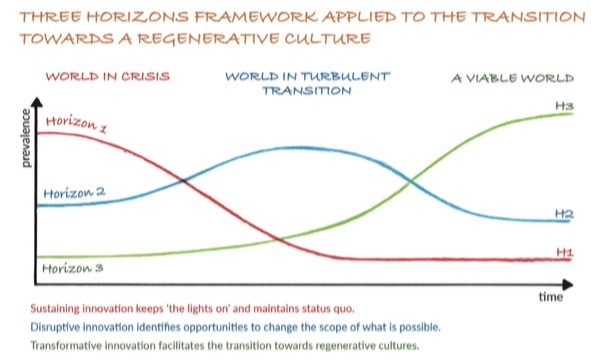
Allows different people to think of working on different paths, which all work out together naturally. Small steps needed for bigger ones, big strategies that make room smaller ones, things to wind down, things to build up, temporary measures for both.
Based on forest of cultural succession. A very loose model, much of it misleading for transforming our growth system. Might be applicable to the progress of humanity through its long series of failed civilizations, making cultural progress all along. Might be applicable to the ebb and flow of the ‘forests’ of political and intellectual fashion as some of us stumble around trying to imagine the future and others find ever more dastardly ways to say NO.
A wonderfully intuitive model, starting with local innovation in designing for internal human needs and external responsibilities builds familiarity with the natural system model of cells in the environment, envisioned to extend to our whole world to take better care of ourselves and the planet. Join the movement.
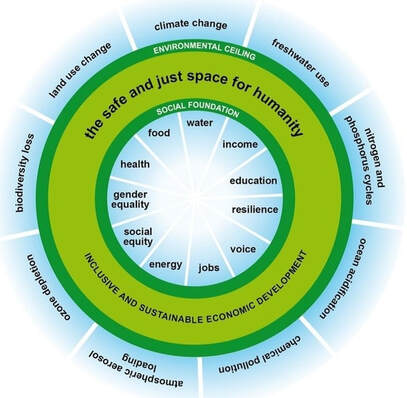
The only way to address our global limits is with global coordination, and for many things global coordination is absent. The nine planetary bounds referred to in Doughnut Economics are certainly critical, but there are a great many others going unmentioned, equally critical. These include:
escalating disaster risks due to overdevelopment and climate change
the growing long-term economic damage to capital resources,
government problem-solving failures
growing governmental lust for power
aging & inflexibility of ever more interdependent and complex systems
growing social polarization, ….. and other great systemic world crises.
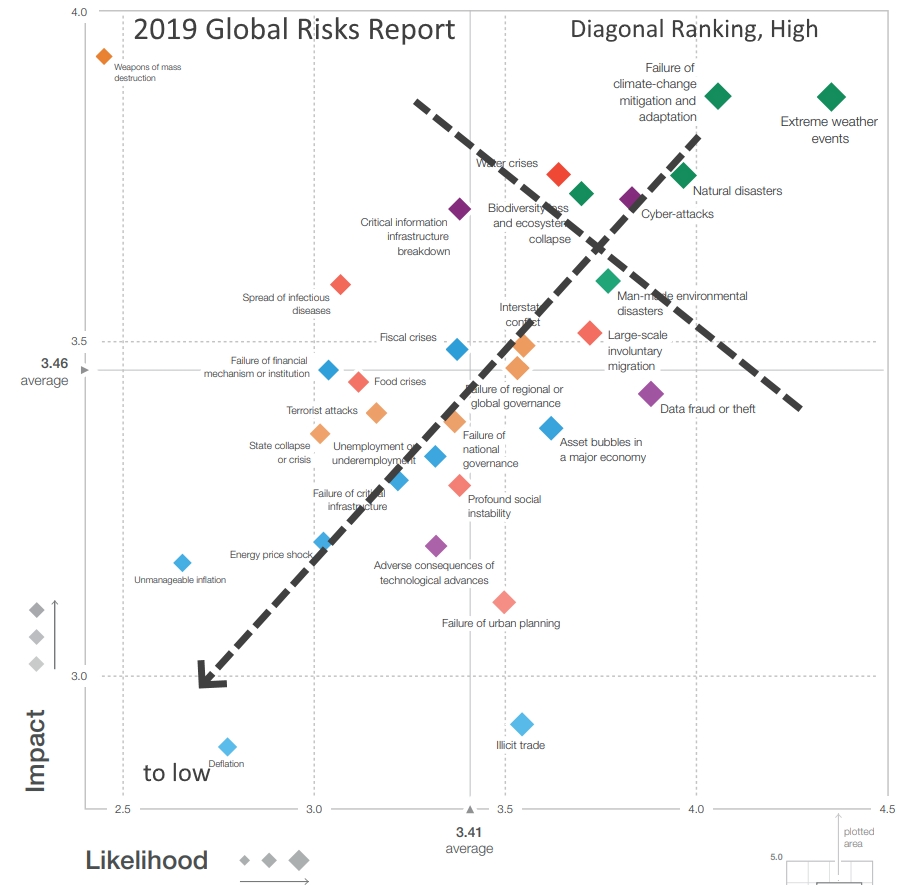
Here’s my long list of planetary boundaries we are rapidly crossing, my Top 100+ Global Crises Growing with Growth. It is based on collecting lists from high-level reports, the major crises getting brief notice in the news, and my own description of flashpoints of unsustainable systemic change. Here’s a link to the 2021 Global Risks Report.
It is my belief that these kinds of growing systemic threats can only be reversed by a movement of global business and investors choosing to shift resources from pushing the harmful limits of wealth to fitting in with a healthy world society and environment.
This is a preview of my new submission to Ecological Economics Please have a look at and comment on the review copy FYI Some of the figures and captions are below
Jessie Henshaw sy@synapse9.com
<<<<<<<<<<<<<>>>>>>>>>>>>
Abstract: Organized human and natural systems generally develop by an observable process of growth, with a beginning, middle, and end. Examples range from the growth of organisms, cultures, and ecologies to that of businesses, social movements, weather systems, even personal and social relationships, and many more. Close observation reveals organizational growth to be a progressive building process of self-organization. Most recognizable are its recurring three shifts in direction, each followed by a development period. That six-stage pattern can guide the study of a growth system’s internal and external designs, recognizable as a series of milestones along an “S” curve assembly line. That common model allows useful comparison of all kinds of natural and human-designed growth systems, using a diagnostic as opposed to a deterministic research method, keeping what “ought to be” in close association with “what is.” Discussed are the historical roots of the field, a set of pattern recognition tools, three brief pedagogical case studies, and an eco-economy view of our global growth and its natural time to turn.
<<<<<<<<<<<<<>>>>>>>>>>>>
ow living systems develop their complex organizational designs by rapidly evolving self-guided growth processes has fascinated scientific observers for millennia. Natural growth also still resists scientific definition though. Perhaps the delay comes from scientists asking the wrong questions, looking for deterministic rules for nature’s creative processes, rather than generative patterns of natural design.
Here we start from the broadest patterns, like how growth processes are evident throughout nature, even in every kind of work people do. Growth generally displays a three-part development cycle of beginning, middle, and end, but like a tree expands on opportunistic rather than deterministic pathways. Our problem with understanding it, then, might come from having so singularly studied nature for the deterministic patterns we can rely on, pushing aside the study of nature’s indeterminate building processes.
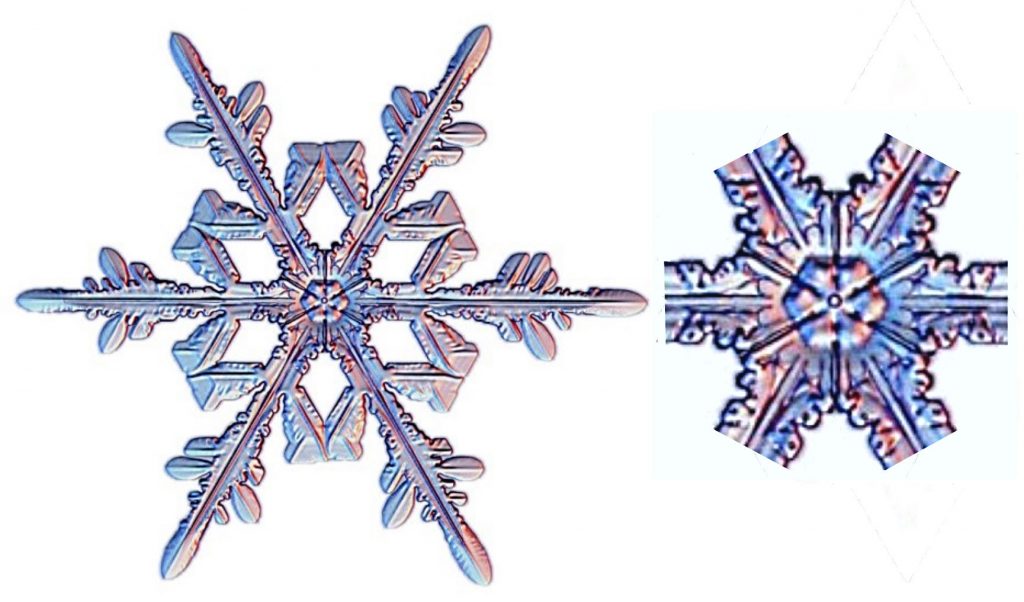
Another commonality is that whether it’s the growth of a mammal, a business, or a snowflake, the ultimate end is a state of complex perfection of design. On close inspection, that highly organized end-state seems to come from having alternating periods of diverging then converging (positive and negative) development feedback, first getting growth to start-up to then turn to perfect the design as growth finishes-up, as if generating a framework then filling it in.
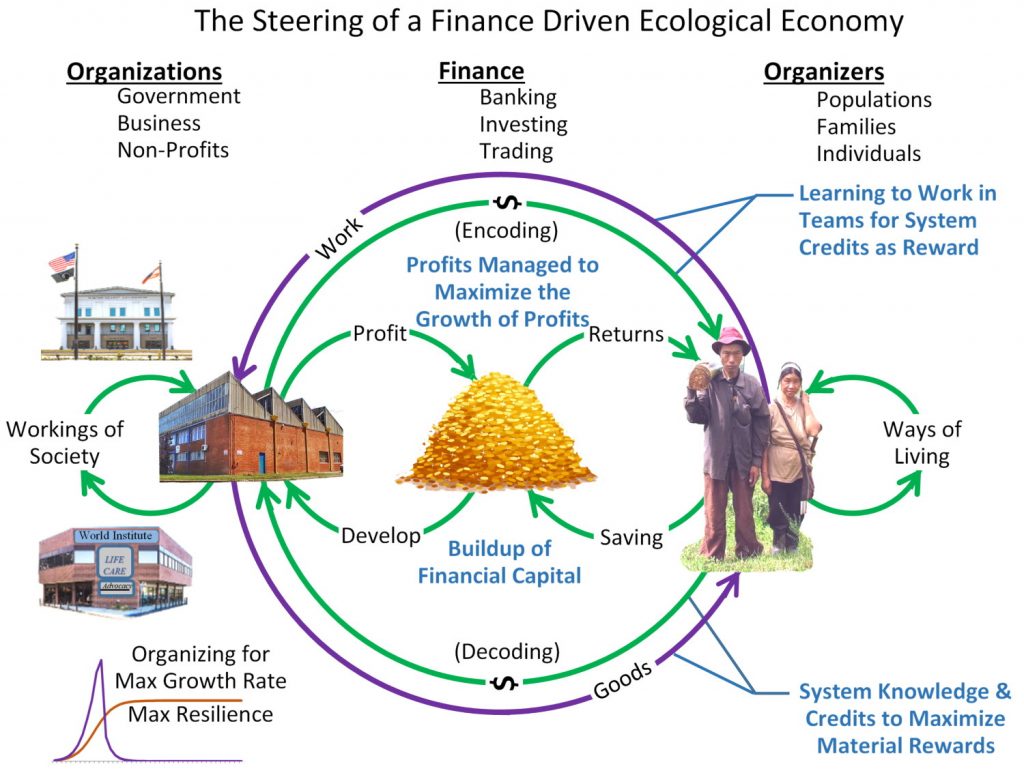
fig 1 – A Snowflake and its Central Kernel: Look at the layers of its kernel that built up around central dot. The first hexagonally differentiated shape you can easily see is still quite simple, but the next layers become quite complex. The six spines that emerge develop nearly identical filigree as if originating from an organizationally “entangled” first crystal core.fig 4 – Three stages and three turning points of natural growth. 1) the seed event, Image, and following start-up growth period (red) – Individuation 2) the turn forward event, Image, and finish-up growth period (blue) – Maturation 3) the arrival event, Image, and Climax life period (green) – Fulfillmentfig 5 – Economic systems need to use energy to harvest more energy. The ratio is called EROI, a ratio of returns to costs and has to stay greater than one for the system not to shrink or collapse. Usually, a new system’s first energy source, EROI-1, is consumed as the system develops a more lasting resource, EROI-2. Succession from one resource to another can also be repeated (not shown), like climbing a ladder, or it may fail.fig 9 – In a finance-driven eco-economy, choices by businesses and investors determine the directions of future development, predominantly based on what will be most profitable in the short term, whether by serving of quietly manipulating the markets.
Every economy is also an ecology, both a self-organizing system of mutual benefits which also relies on having positive net resource flows; both beneficial design and net material profits. Together these two faces of natural systems make a complex whole one can study from many points of view, but rely critically on all its parts.
Networks of mutual benefits are mostly composed of organizational, design, and qualitative relations, like that a cup holds water, or that a fish swims, or whether someone knows how to work with you, or whether a shop serves its local culture. Those aspects of design, organization, and qualities have no numerical definition but create the systems of mutual relations on which the designs of life rely, Some may be products of nature and others of fine arts and crafts: a fine meal, a delightful garment, or a meaningful film as inherent benefits of life.
Those benefits of life are also needed for the systems that deliver the physical resource flows that market price and investment returns determine the investment in, letting one calculate the budgets by which our world economy is managed. So to understand any particular living system, one needs a clear-headed understanding of how those two sides work together.
— A presently elevated growth rate of CO2 in the atmosphere directly linked to globalization.
— And resulting likely 1.5 degree C warming by 2030, TEN years earlier than the recent IPCC estimate.
— Plus a fascinating story of diagnostic data science discovery.
Yes, it is a somewhat radical approach, but is fully data driven, meticulous, and at the high side of the IPCC uncertainties, making it plausible. So it should challenge others to try to confirm or dispute the findings. Losing 10 years in preparing for 1.5 degrees C also makes this finding, if true, extremely urgent to respond to.
(A Major Edit of a 10/8/18 version, republished 4/8/19 – Jessie Henshaw)
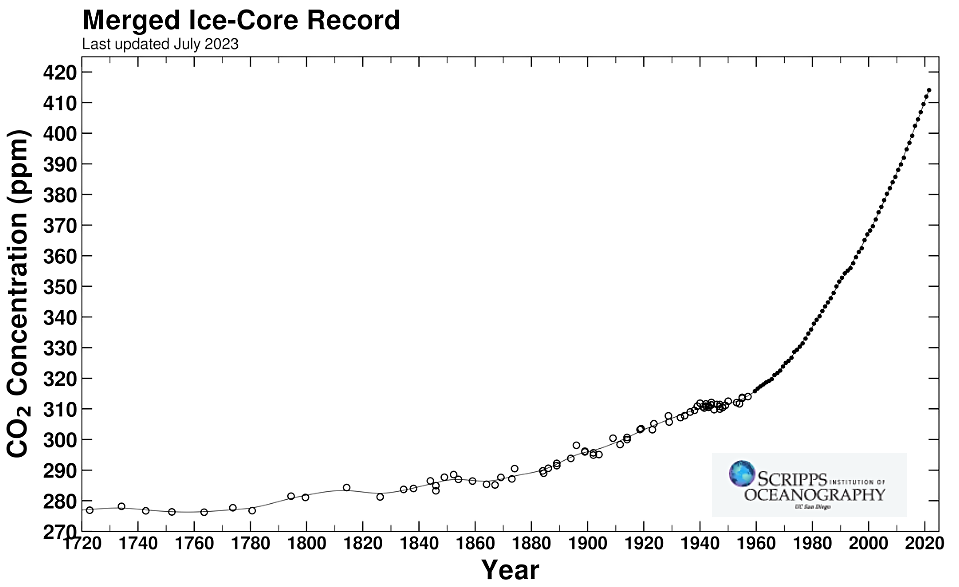
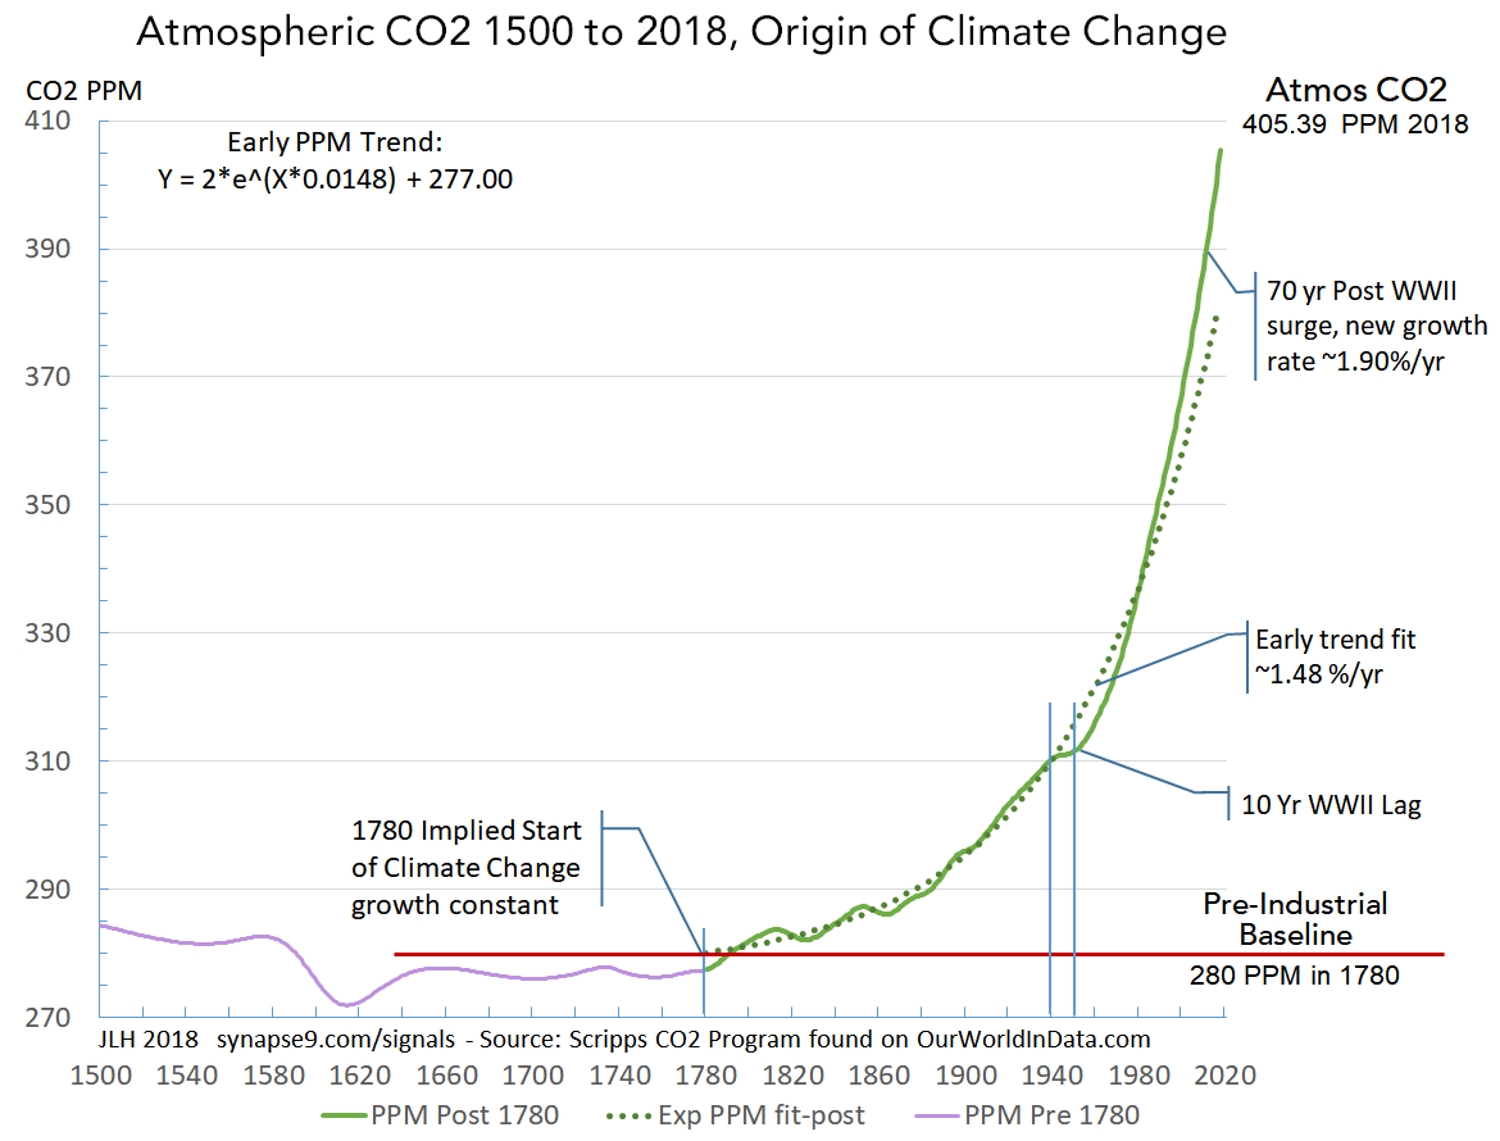
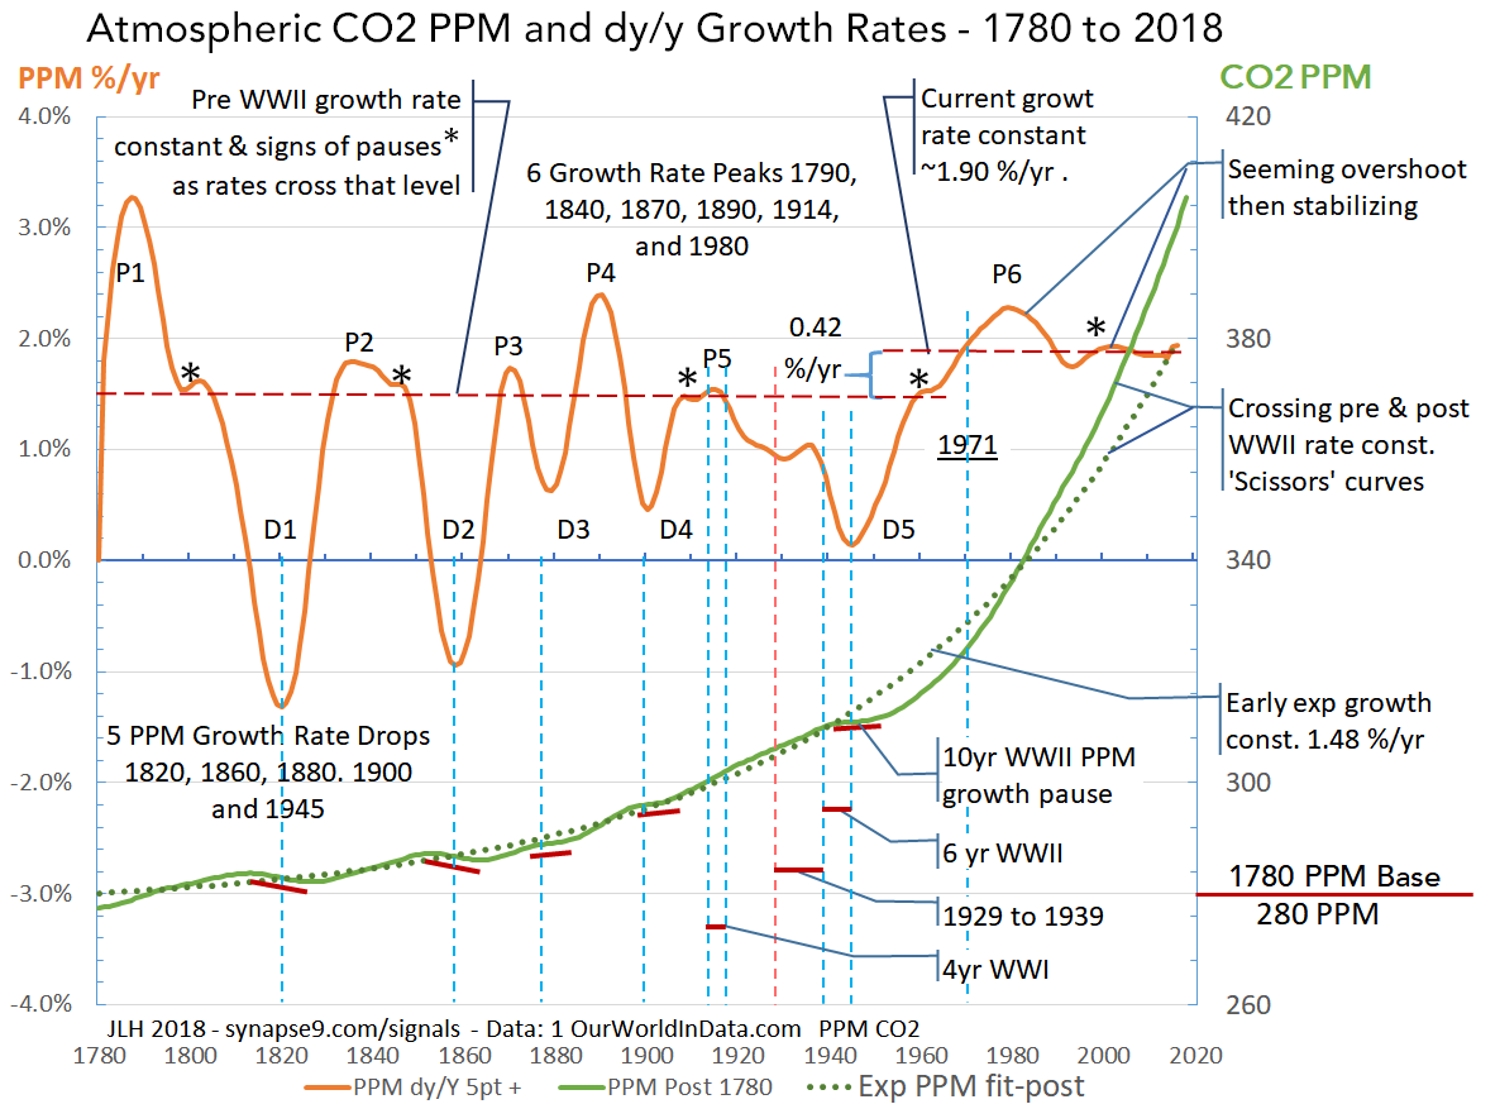
The Path of Atmospheric CO2 – To understand climate change it helps to start with the whole picture, the great sweep of increasing concentration of CO2 in the atmosphere shown in Figure 1, as the main cause of the greenhouse effect. Looking at where it began, you can clearly see the fairly abrupt shift in the trends at about 1780, also about the same time as rapid industrial growth was beginning, seeming to mark the abrupt emergence of fossil fuel industry that the rest of the curve clearly represents.
Look closely at the relatively lazy shapes of pre 1780 variation in CO2 back to 1500 (purple) and how that pattern differs from the abrupt start of the growing rates of increase (green line) after 1780 an how closely it follows the mathematical average growth rate curve (dotted). Note how the trendline threads through the fluctuations in the data starting from 1780. The way the data moves back and forth *centered on the constant growth curve* is what implies that the organization of the economy for using fossil fuels had an constant growth rate, of 1.48 %/yr. Hopefully that seems rather remarkable to you, but the data is clear, that the global economy has a single organization for behaving as a whole, as a natural system, with a stable state of self-organization in that period.
Figure 1 – The abrupt emergence of climate change with the industrial economy, evident in the constant compound growth of atmospheric CO2 PPM at 1.48 %/yr, from 1780 to WWII, followed by a pause and then the transition to the even higher growth rate 1.90 %/yr, That second growth spurt, continuing to the present, presumably reflect the modern reorganization of the world economy for maximum growth informally called “globalization.”
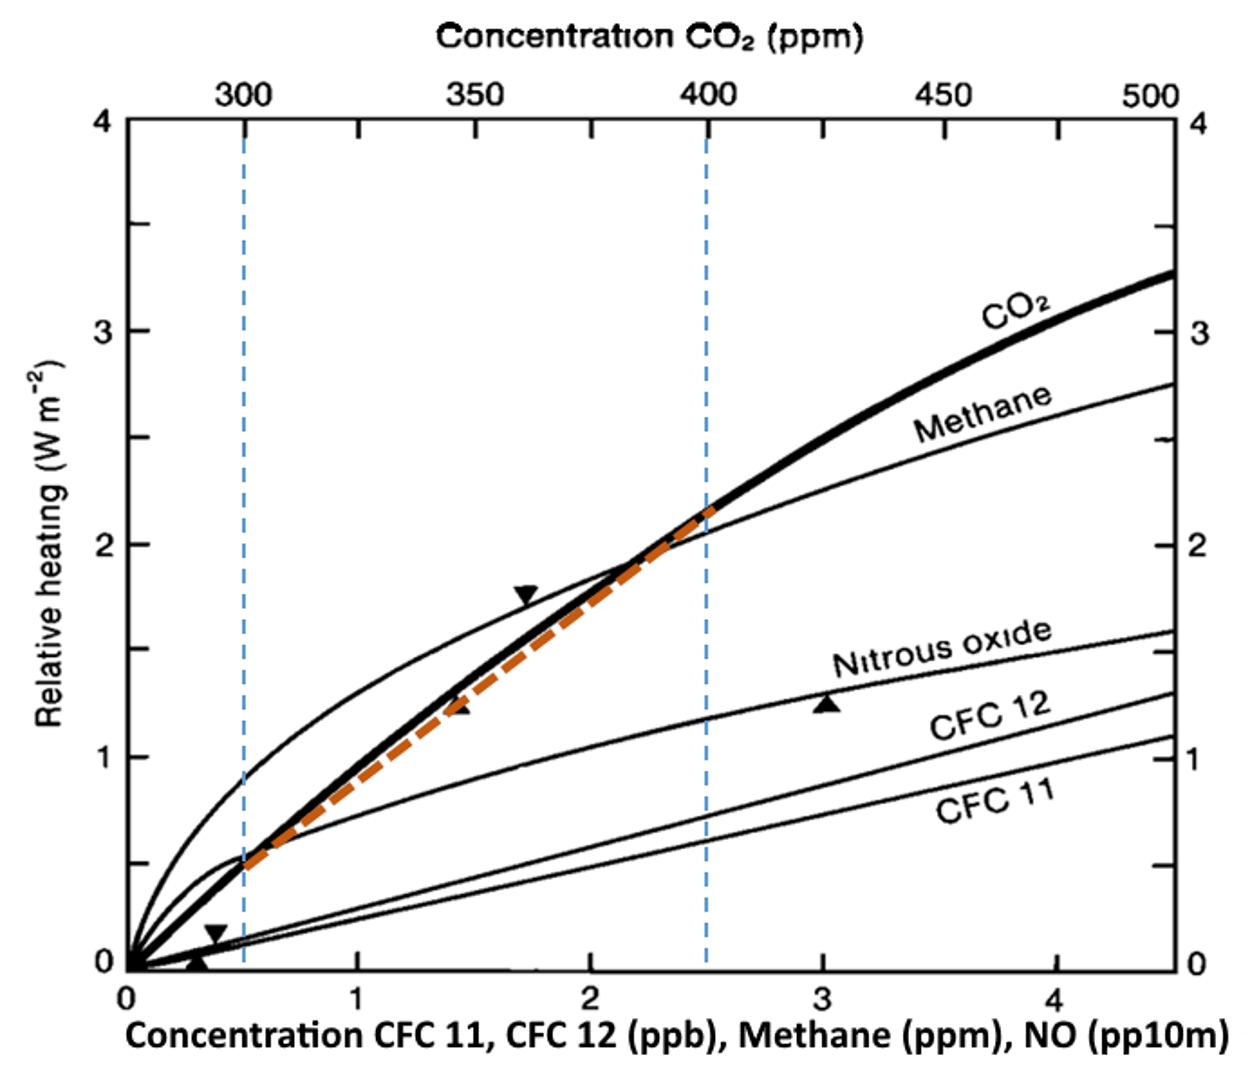
We know from the absorption of heat radiation by CO2, creating the greenhouse effect, that the CO2 greenhouse effect is heating the earth in relation to its concentration in the atmosphere. What implies that relation is close to linear, making the effect directly proportional to the cause, is shown in the Figure 2. The dashed brown line shows the slope of the relation, closely fitting the actual gradual curve, at least between 300 to 400 PPM, the thresholds that were crossed in 1914 and 2016 respectively, a period of 102 years. Atmospheric CO2 is increasing much faster now, though, so the next increase of 100 PPM, to 500 PPM, will be reached much more quickly rising at its current stable rate of 1.9 %/yr rate. If that rate continues 500 PPM will be reached in only 30 more years, by 2046. That large acceleration is the effect of the current higher exponential rate of increase. Of course, considering the rapid compound acceleration of the cause of climate change, and the alarm people are taking now, quite a lot could happen before 2046.
Figure 2 – The “relative heating” of the the earth to Atmospheric CO2 concentration, indicating temperature change has an approximately linear relation to CO2 (brown line) for the range of concentrations (300 to 400 PPM) over recent times. The triangles indicate concentrations in 1985. (Mitchell 1989, Figure 6 w/ added color)
The Annual PPM Growth Rates – Figure 3 shows the growth of Atmospheric CO2 (green) with the details of its fluctuating annual growth rates, to depict both the constants of the growth curve and it’s irregular growth rate interruptions. The individual interruptions raise lots of interesting questions, but perhaps the most important feature is that they are quiet temporary, as evidence of the constant behavior recovering again and again.
The upper curve shows fluctuating annual growth rates (lt. axis, PPM dy/Y) for the curve below, the CO2 PPM concentrations. The peaks and drops of the growth rate align with the small waves in the concentration (rt. axis). Note that the large drops in the growth rate that seem to snap right back to the the horizontal dashed red lines. That seems to show that they mark processes that absorb and then release CO2 again, as they do not seem to affect the average growth rates of PPM concentrations as a whole, around which the annual fluctuations homeostatically fluctuate.
This diagnostic approach is for raising questions like the above, using the annual growth rate to expose the dynamics of the curve for a somewhat anatomical picture. In this case it’s of the homing dynamics of the global growth system as it first hovers around the rate 1.48 %/yr from 1780 up to WWII, and then shifts to hovering around the higher rate of 1.9 %/yr as it stabilizes from 1971 to 2018. You might think of these two long periods of homeostatic growth rates in CO2 concentration as representing periods of regularity in the causal systems, global economic growth and the carbon cycle response, seen through the lens of atmospheric CO2.
You might think the large departures from the regular trends would be great recessions perhaps, that then “make up for lost time” on recovery. I could not find corresponding recessions, though, and for the great recessions I checked there do not seem to be notable dips in CO2 accumulation. To validate this kind of research one has to go through that kind of thought process for every bump on the curve, either a tedious or exciting hunt for plausible causes than then check out with other data.
What seems most unusual about the big dips in the CO2 growth rate (D1, 2, 3, 4, 5) is that 1) they do not occur after WWII and 2) they rise and fall so sharply and have no lasting effect, seemingly temperature sensitive as well as absorbing CO2 later released. I can’t say whether it is feasible or not, but something like vast ocean plankton blooms might have that effect, absorbing and then releasing large amounts of CO2. There’s also a chance the way the raw data was splined and the growth rates smoothed, to turn irregularly spaced measures into smooth curves, might also have unexpected effects. Whatever phenomenon causing the big dips was, it appears to have been interrupted by the rapid acceleration of warming that followed WWII, as evident in the smooth and uninterrupted rise in most recent and best raw data. Those are at least pieces of the puzzle that might help someone else narrow it down.
Figure 3. Atmospheric CO2 concentration (CO2 PPM)(rt. scale) and its annual growth rates (PPM %/yr)(lt. scale), showing the change in growth constants before and after WWII. The key evidence of these being different organizational states of the world economy (before & after WWII) is regular “homeostatic” (home seeking) reversal of trends departing from the growth constants. It is the post WWII growth constant state of 1.90 %/yr that is preventing normal policy process from intervening in climate change, and needs to be “recentered” on learning from nature rather than overwhelming nature for our survival.
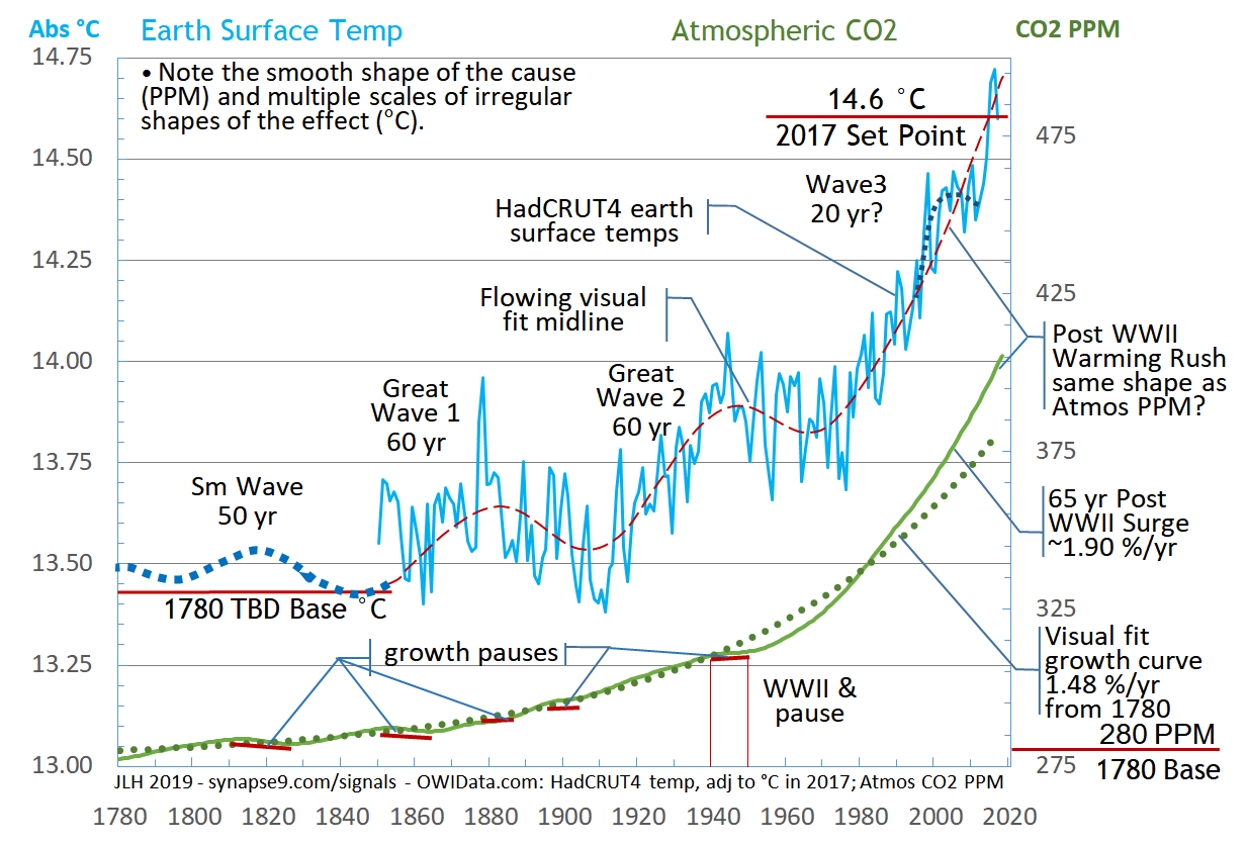
Comparing the CO2 cause and degree C effect – The main purpose of Figure 4 is to compare the history of earth temperatures (blue, ‘C, lt scale) with the curve of atmospheric CO2 (green, PPM, rt scale). The CO2 PPM data is the same Scripps atmospheric CO2 data and scale we’ve seen below. The temperature data is from the HadCRUT4 records used by the IPCC. In this case the original anomaly data relative to the 1850-1900 average have been converted to absolute ‘C values, using a conditional set point of 14.6 ‘C in 2017. In a way it is as arbitrary a coordinating value as the others people use. It’s chosen here first for being a more familiar scale, but also so that 1780 initial values for PPM and ‘C can be determined as initial values for the greenhouse effect. Those baselines are essential for defining the exponential growth rates of the PPM and ‘C curves. The 14.6 ‘C value was based on an expert’s estimate.
Figure 4
Aligning the curves for Figure 4 lets us look closely to see if any shapes of the cause of the greenhouse effect (PPM) are clearly visible in the shape of the effect, global warming (‘C). Does anything in particular jump out? First might be the differences, one curve quite smooth the other jittery, both having wavy fluctuation patterns too, but of very different scales and periods. The first thing you might ask about is how regularly irregular the ‘C curve is seems to be. That variation is thought to be mostly due to annually shifting ocean currents, along with weather system changes and the difficulty of measuring the temperature of a complex varying world.
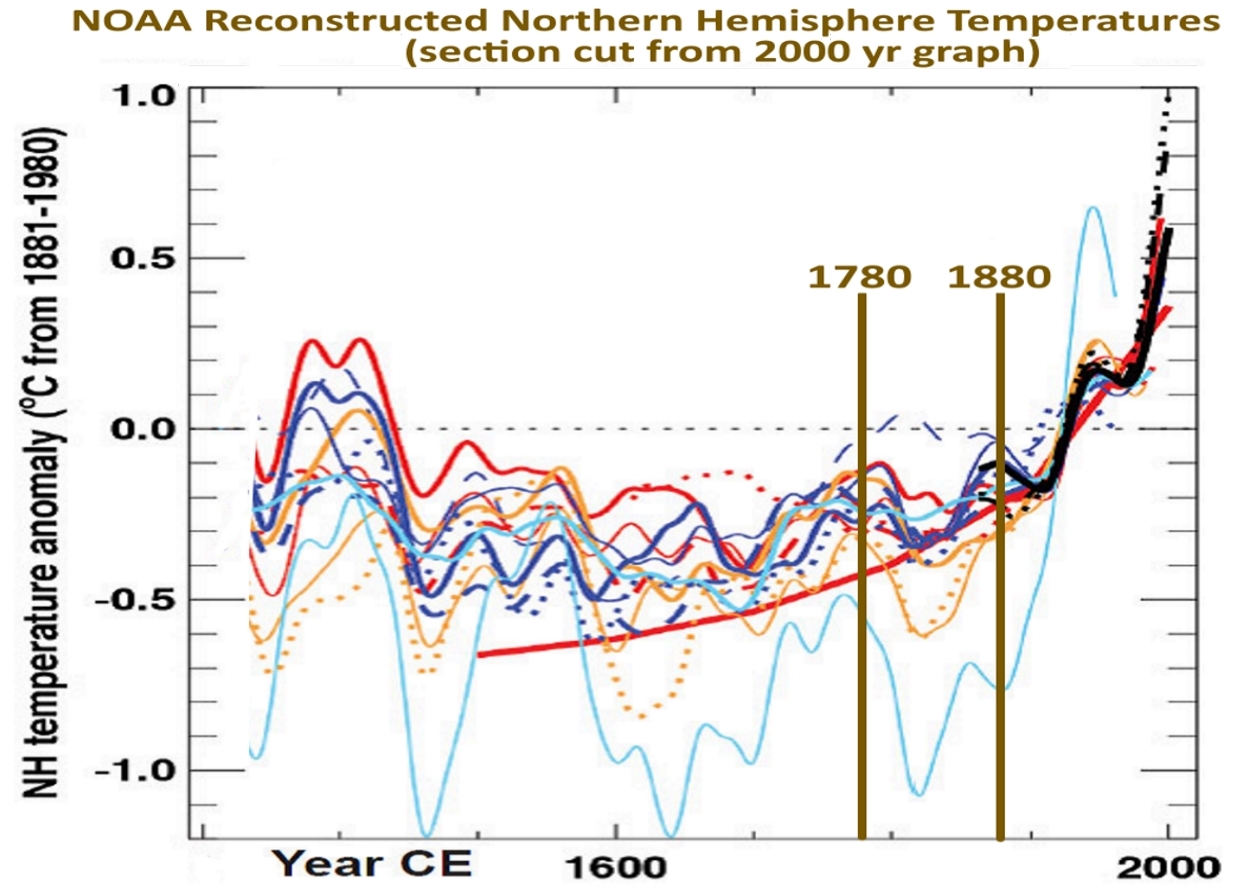
The ‘C curve (Figure 4) also shows the two ‘Great waves’ (#1 and #2) in earth temperature that appear to be independent of the greenhouse effect. The dotted red line was visually interpolated as the midline of the irregular but seemingly quite constant fluctuating annual temperatures of the HadCRUT4 data. The blue dotted line was added to suggest earlier large waves in earth temperature copied from the shapes in the ancient temperature reconstructions seen in Figure 5. I physically overlaid those reconstructions of ancient temperatures on Figure 4, drawing a continuation of the Figure 4 midline curve that fit the Figure 5 curves.
One might say the minima of the great waves in the ‘C curve display a trend somewhat like the general trend of the PPM curve, say from 1780 to 1980. The one shape that makes the two curves seem really connected, though, is the way the sharply rising PPM curve (the implied cause) and ‘C curve (the implied response) both start following a “hockey stick shape” in the 1980s. It even seems the shape of the ‘C curve interrupts the great waves as it takes off exponentially, breaking a rhythm that seems to go back many centuries. There is a possibility that the great waves represent upper atmosphere standing convection patterns waxing and waning, something that increasing convection intensity could interrupt. Perhaps that would help others find what the great wave cycle, or not. Since theory suggests the trends of both cause and effect have a linear component Figure 6 shows a linear scaling of the PPM curve to see if it and the ‘C curve can fit.
Figure 5 – NOAA (2007) 1300 to 2007 Northern Hemisphere record of temperature reconstructions. Measured from a 1881-1980 baseline. This it taken from a longer history keeping the units and adding a title and dates 1780 and 1880 (brown). That is the period after the greenhouse effect began before it was visible in the records of earth temperature. The red line shows an old NOAA speculation that warming developed earlier and slower than found here.
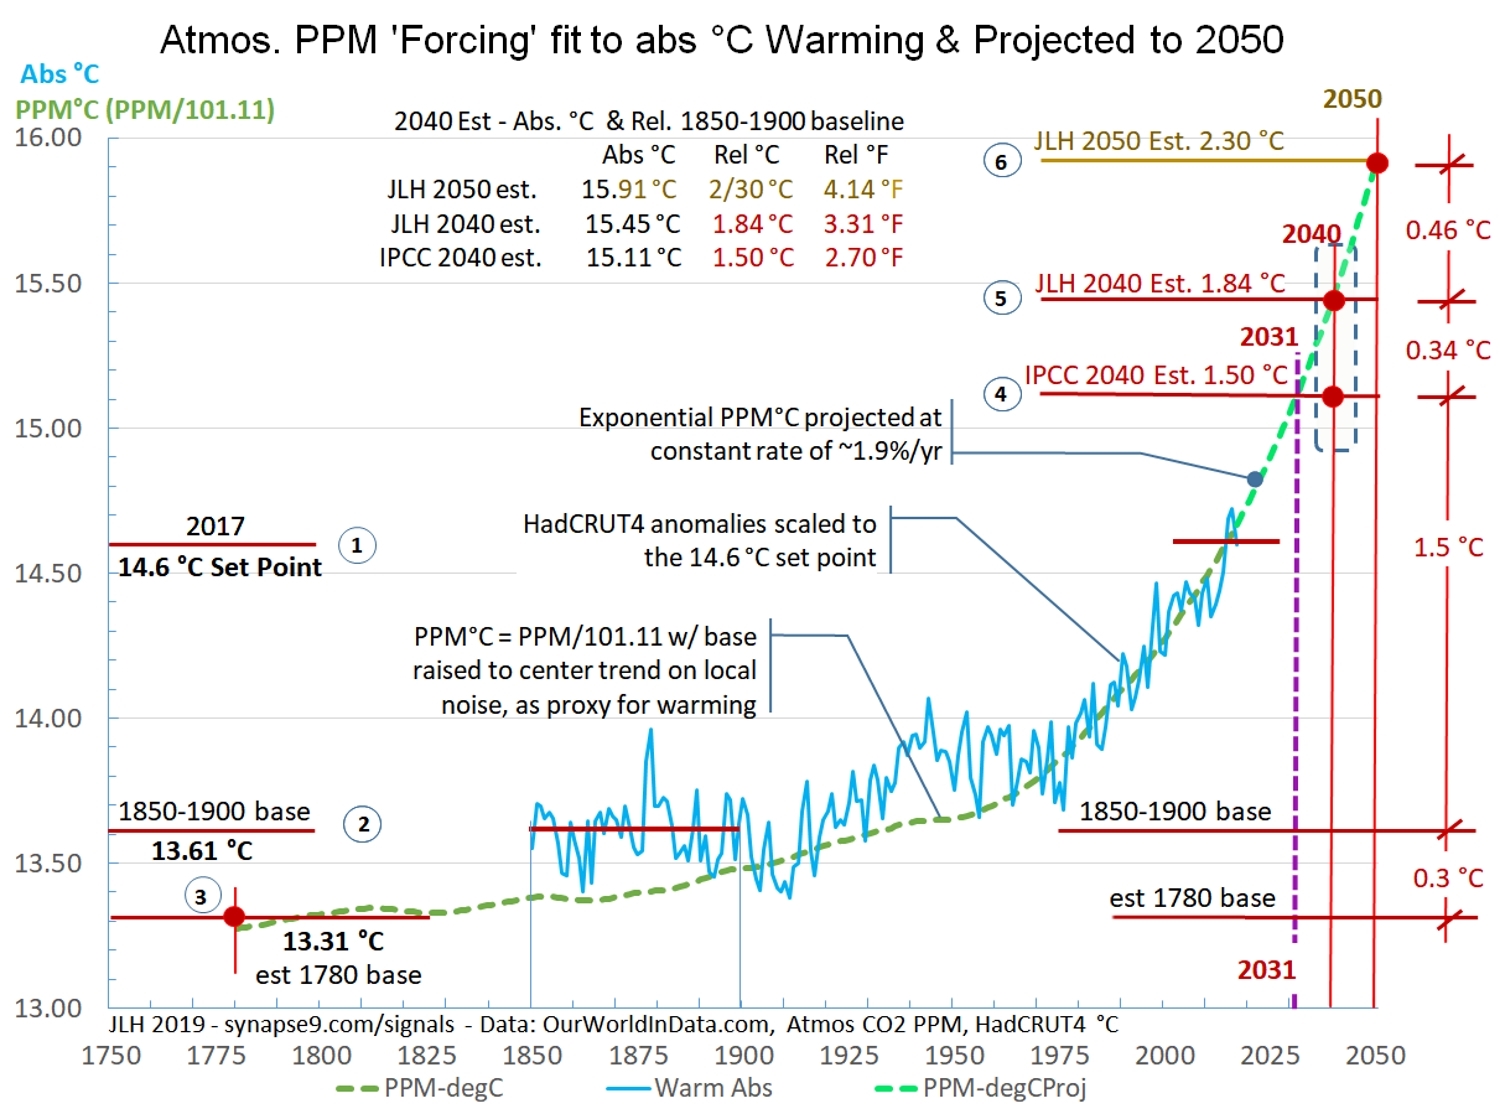
Scaling CO2 PPM to Make a ‘C Proxy – The reason to scale PPM to emulate the dynamics of ‘C curve is simple. The ‘C fluctuation is so erratic the variety of curves to predict its future is rather extreme, so people have been generally using a straight line. An exponential curve is not a straight line, though. So the quite regular shapes of the PPM curve, including its clearly measurable growth constants, 1.48 % before and 1.9% currently, do make it a prime candidate as a useful proxy. Even if the trend has a clear direction now we of course have to allow for increasing uncertainty over time. Adding to that are the plans for dramatically cutting CO2 despite a world economy dramatically increasing its production, a tug of war that could be interrupted by actual war or other economic downturn.
Where the current stable growth rate of climate change seems headed, knowing the PPM curve should be linearly proportional to the greenhouse effect, we experimentally scale CO2 PPM see if it fits the ‘C curve in a logical way (Figure 6).
Scaling the PPM curve to fit the ‘C curve makes a PPM’C proxycurve, hoping to fit the midline of the highly irregular ‘C curve from 1980 to the present. Both the units and the baseline are not determined, though, to produce the proxy curve in PPM’C = A*PPM + B, using a linear scale factor A and a baseline B. A third determinant is then finding a optimal fit between the very different earlier shapes of the curves. So basically I tried lots of things, and found my initial assumptions were mostly wrong. Initially I made the mistake of trying to fit the PPM’C curve to the midline of the earlier ‘Great waves’, and tried several ways until it was clear they were all wrong.
Then I realized those earlier great waves were really not related to the greenhouse effect. So my greenhouse effect projection might better be interpreted as coming up under the earlier systems, like it actually looks. That was purely a graphic device at first. Then when I adjusted the PPM’C curve to pass under the ‘Great Waves’ I set it to go through the miline of local fluctuations instead of the Great Wave departures. Suddenly the fit of rapid growth period became as perfect as I could ask for. I spent some time trying to figure out why, studying all the loose ends, in the end resolving that’s what the data seemed to say. That PPM’C curve then becomes the hypothesized most likely “real” rate of greenhouse effect climate change, and offering a much more narrowly regulated way for projecting its future.
Figure 5 shows both the best fit scaling of the PPM’C proxy curve (dark green dashed line), and its extension to 2050 at its presently stable growth rate of 1.90 %/yr (dashed light green line). Yes there are various uncertainties, but the threat of climate change so far has seemed to be from underestimating, not overestimating, and the findings do appear to be well within the IPCC uncertainties given the difficulty of projecting the temperature data directly.
I think it means that reaching 1.5 ‘C by 2030 is a much more probable estimate of the current trend than reaching 1.5 ‘C by 2040.
Figure 6 – The PPM’C curve scaled to closely fit the HadCRUT4 data and then projected at the homeostatically stabilized growth rate of observed in atmospheric CO2. How long this projection might hold depends on how robust the global natural and economic systems driving the growth rate in atmospheric CO2.
The Economy as a Whole – How great a new threat this acceleration in atmospheric CO2 pollution and its greenhouse effect are seems to rest on just how stubborn the global homeostatic regulating systems observed are. That could really change the climate mitigation picture, and help explain why there has been only negative progress in slowing CO2 pollution. So far is seems to have been neglected, with negotiation over mitigating climate change not seeming to take into account the organizational inertia and persistence of the global economic system as a whole.
Figure 7 shows a group of major indicators of the global economy that were selected for having constant growth rates from 1971 (the earliest data for some) to 2016. The GDP PPP curve in trillions of 2016 dollars is growing the fastest, and each of the other curves was indexed to GDP in 1971 in proportion to their relative growth rates. For example, since total economic energy use is growing at about 2/3 the rate of world GDP that variable was scaled to 2/3 of GDP at 1971. This device displays the steady relation between them called “coupling.” That the same proportionality of the growth curves is constant throughout it indicates each of these curves reflects the behavior of the same system. What seems to cement the view that the global economic system appears to be behaving as a whole is the visual evidence that the data of each of these series, like the CO2 PPM data we discussed at length before, seems to fluctuate homeostatically about the growth constant.
What physically coordinates the economy’s coordinated relationships between different sectors displayed here as growth constants seems likely to be cultural constants of each cultural institution, or “silo” of the world economic culture. Every community seems to develop its own expected way for things to work and change and seems to become the way the different sectors end up coordinating their ways of working with each other. That all of this is organized primarily around the use of the exceptionally versatile resource of fossil fuels then indicates that a deeper reorganization of the economy than a swapping of one set of technology for another will be involved. It should suggest to any reader just how very much of the world economy would need to be reorganized, and to be reminded that the last times the world economy was sufficiently disrupted to be reorganized were during WWII an the 1930s.
This topic is also the subject of a longer research paper. Science review drafts are likely to be available later in April 2019.
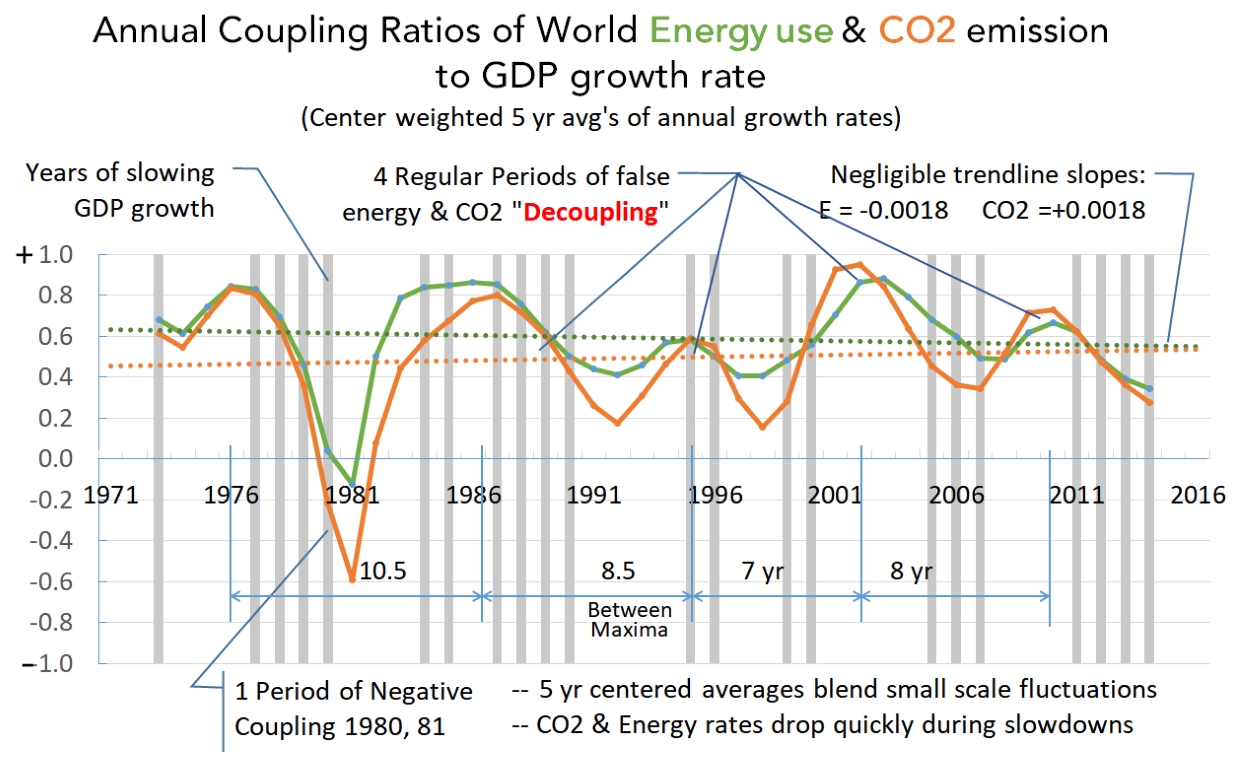
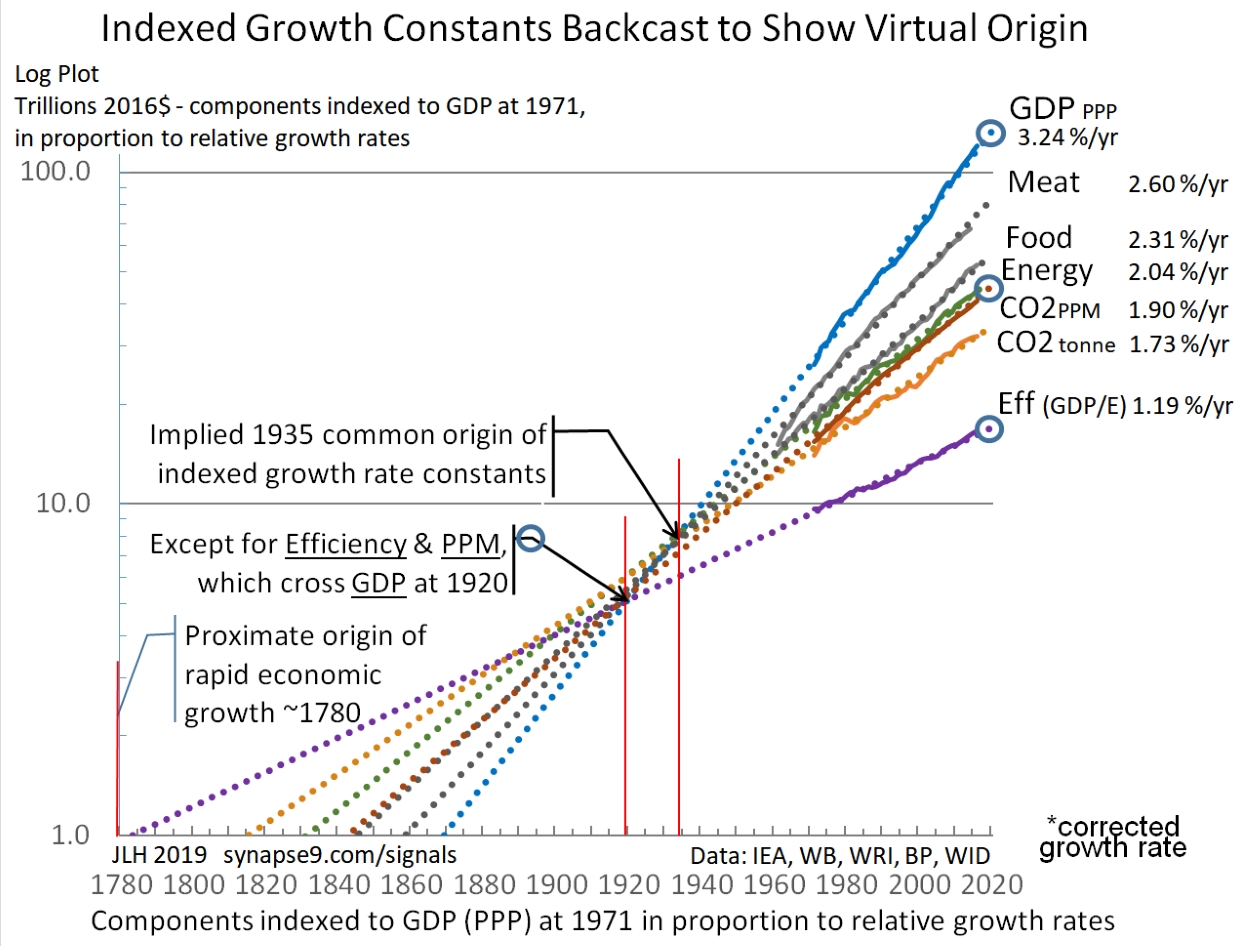
Figure 7. The global economy working remarkably smoothly as a whole system of coordinated parts, seemingly much like theory says it should, but most people don’t see because they don’t look at the behavior of the system as a whole.Figure 8 – Smoothed annual growth rates of recent world energy use and CO2 emissions, showing close coupling of their fluctuations with relatively insignificant trend.Figure 9 – Log Plot of Figure 7 variables with a 1780 to 2020 time scale. The backcasting of their exponential constants displays the convergence with the backcast GDP trend of four of them at ~1935 and with two others (blue circles) at ~1920. The effect implies the stable coordination of the parts of the global economic growth system established by the 1970’s was in the 1920s and 30s.
Work in progress… Below this line is old text that may be edited in pending updates.
It’s a powerful technique for understanding complex systems, such as the world economy, that behave smoothly as a whole. The most important observation is just that. The system as a whole and these whole system indicators are not separate variables, and the smoothness of the curves shows the system as a whole behaving smoothly as a whole over time.
From our local views of the world that often does not seem to be at issue, though it really is the main force behind all the changes everyone is struggling to adapt to. Individual businesses, cities and countries generally have a quite irregular experience, as their roles in the whole continually change. What the smoothness of the curves and the change in the system as a whole really means is that the world economy is working the just the way it is (financially) supposed to. It is being globally competitive the way money managers manage it, and continually reallocating resources and business to where they will be best utilized, resulting in most every part having somewhat irregular experience to make the whole behave smoothly. The uniformity of these global indicators also says is that their origins all point back to ~1780, when modern economic growth began. We have reasonable measures US economic growth from ~1790, …and so went the world!
Smooth exponential curves and the systems generating them are, of course, among the things of nature with inherent “shelf lives”, relying on systems of developing organization of multiplying scale and complexity, certain to cross thresholds of transformative change. In nature, growth systems generally develop to one of two kinds of transformation, stabilization or destabilization, the crashing of a wave that doesn’t last for example or the thriving business that can last for generations. What characterizes the difference for the emerging systems that last is that, while becoming strong with compound growth (like the systems that don’t last also do), they become responsive and refine their systems to stay strong. In economic terms that’s remaining profit seeking they “internalize their externalities” to mature toward a peak of vitality rather then failure. It’s a choice made in mid-stream.
Understanding what will make that difference in outcome for our global growth system will partly come from people getting a better understanding of how we got here, as shown in the Figures 1, 2, 3 & 4. The growth of technological civilization relies on ambition, creativity and resources, and methods that we could potentially change. How economic growth is largely managed by the application of business profits to multiplying business developments, what makes GDP to grow. If our decisions were to internalize our externalities that is also one of the things that might change, without really changing human ambitions, creativity or resources.
Setting Our Whole system goal,
Making the Earth our good home.
Much of my effort over the past five years fosuces on working with civil society organizations at the UN on the world sustainable development goals (SDG’s). This year, needing to take care of other business, I’m sitting out. It may be ironic, of course, as the challenges of implementing the UN 17 separate goals probably makes:
more and more participants think of how the goals need to all work together,
and can’t individually be achieved without the ‘nexus’ of the whole.
Ultimately my years at the UN was mostly spent identifying the widespread absence of systems thinking in the SDG’s, watching somewhat painfully as the UN spent all its time creating lists of separate goals, as if unaware of their interlinkage. The interlinkage most neglected of course was that of *MONEY*, our main tool and problem. So my writing of that time may be a little out of date. I can tell that much of the systems thinking I found so absent before still is, however.
I have lots of other writings on how “systems thinking” for our world needs to become “systems making”, the next step toward true “homemaking on planet earth”. Finding how societies can make their good homes on earth is the answer. Like ecologies of other kinds do, we can invent our way out of the deepening trap we now find our world economy in, using nature as a guide.
I got fairly frequent applause at the UN, enough to know people are listening, but to my knowledge no one ever followed up on my carefully reasoned recommendations, and no one ever asked me to be on a panel discussing them either. So here I’ve collected some of my old lists of observations on the process, and reiterate my offer to help people understand the guiding patterns of natural system design that I’ve spent my life studying.
A Youtube of one of my interventions for last year’s HLPF gets right to the heart of the matter too!
Notes on how the “UN Development Goals… leave out the Common Needs”(1)
The SDG’s Omit:
how the centers of power can become foundations for a sustainable future
what habits keep people entrapped in the web of ever growing economic inequity.
It also fails to use systems biomimicry to help us design a world that works.
They also ignore the need for a “soft landing” for the whole system, for
a. creating a stable world commons…
b. not just to giving competitive edges to the disadvantaged
They don’t aim to “internalizing all externalities” like the “World SDG” offers.
They also generally omit ideals for the earth as a whole, to make it our good home.
and blindly continues to promoting compound global growth
a. when we are already pressing hard the global natural limits,
b. not looking to relieve of the strains but add to them.
Here are other short posts on the systems thinking to bring into the UN’s discussion to guide us toward the long term goal of making Earth our good home:
I also can’t help returning to a central subject of collective organization I’ve studied my whole professional career, the seeming fate of economies to bring periods of high cooperation to an end with total disaster. The main cause could of course be said that no one in particular is at fault. But there is science enough to identify who could intervene, and do something about it.
My previous post was on the work of Ernst Ising, the physicist who solved a range of collective behavior problems, and how pattern language design science might address the question of what kinds of environments are required for emerging local phenomena. Why economic collapse is always on the road straight ahead for our form of highly cooperative modern economies is one such subject I’d like find physicists using Ising’s work on with.
One might wonder about what keeps driving our highly cooperative world economy toward escalating conflict.
All of humanity seems driven by a “rat race” toward extremes of destructive competition all the time, unable to escape, with most everyone feeling they are reacting in their own defense. That’s not a model for a safe and secure world.
Could we possibly trace how the economic forces, like those driving everyone to achieve rapid growth in economic productivity, and so for the earth and humanity, creating circumstances ripe for triggering grand economic collapses. If we can identify the system doing that we could identify interventions well in advance, to engage a “general protection fault” to avoid the usual mad collective collapse.
Why is an economic cyclone ALWAYS on the road straight ahead
I for one think it boils down to demanding people do impossible things, demanding of our society to do impossible things, like continually doubling the speed at which we collect and use energy and expand our control of the earth. That can only end in tragedy, like it has for economies again and again. Why economies are driven to it, to be ever more productive at ever faster rates, follows unavoidably from their organization for maximizing compound returns from investment, making ever more from ever less. Like being forced to “make bricks without straw”, the regular investment of profits in escalating to create ever more daunting competition ultimately compels cooperation in cheating. In the end that unavoidably disrupts the order, as one of the natural outcomes of pointlessly taking the compounding of returns to its natural limit.
We could do something else if we understood the problem…
jlh
New systems science, how to care for natural uncontrolled systems in context