key organizational elements for the working relationships of complex systems
ideas of complex relationships that fit the reality
We care because of the new bridge it creates between human ideas and the working organization of complex working systems we make, use and need to respond to of all kinds, an emerging broad advance in understanding complex system organization design. The idea of pattern language, invented by Christopher Alexander for architectural design in the 70’s, actually started blossoming some time ago, it a most surprising place, in the creation of complex design concepts for computer programming known as “object oriented design”.
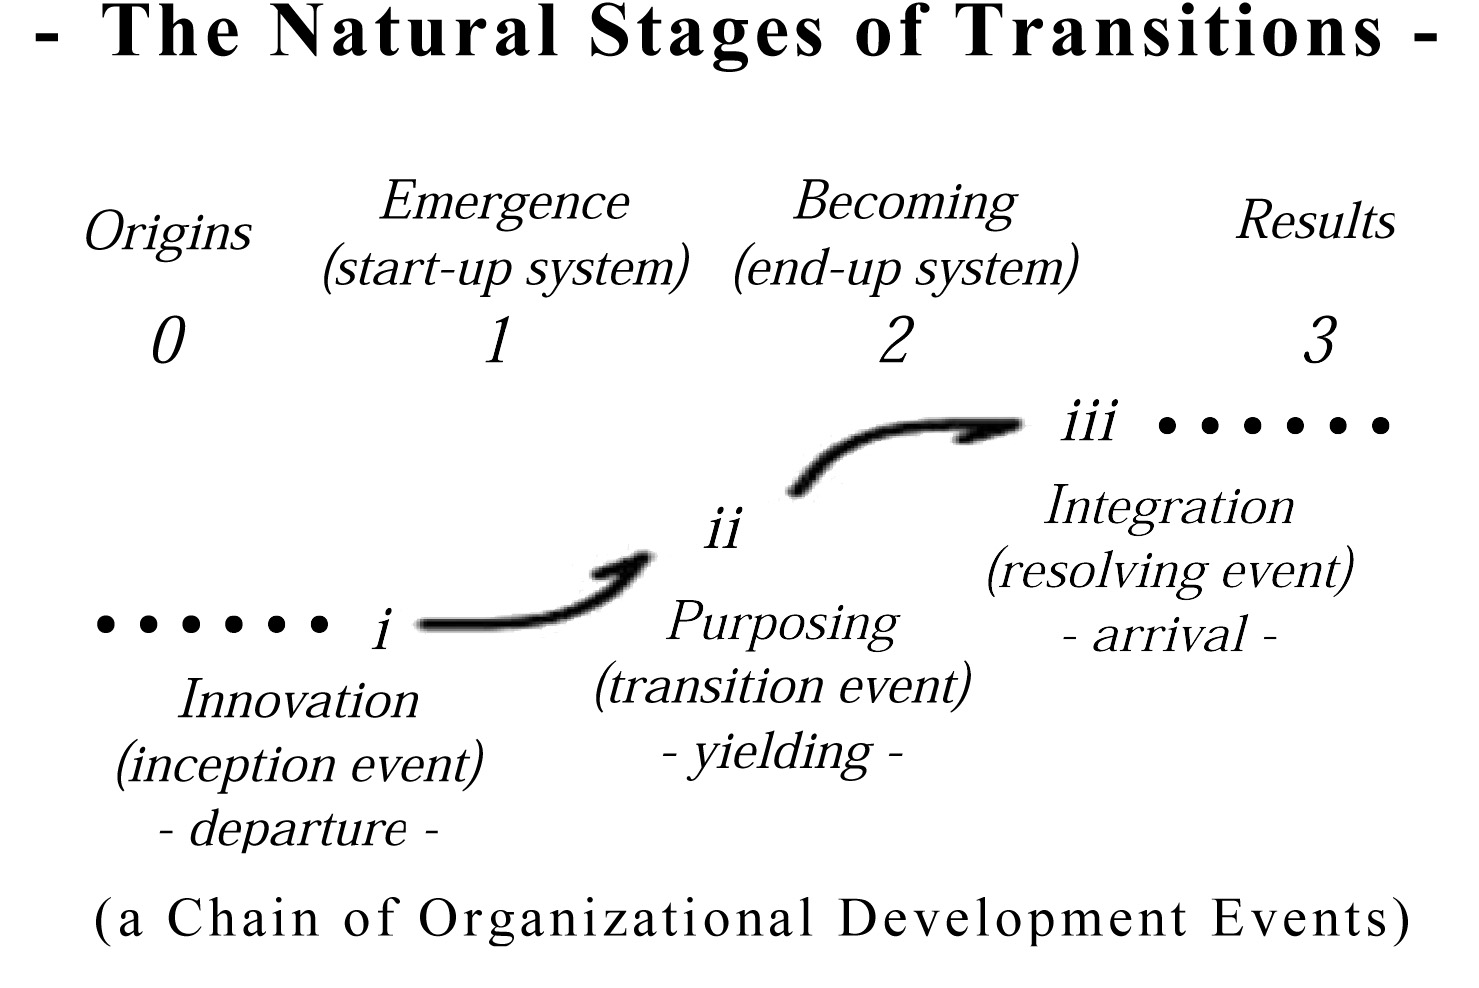
As it continues to expand and mature it is becoming a wonderfully versatile method for sharing and recording expert understandings of “how relationships work”, with application to almost any fields. It became the basis of modern computer programming, as “object oriented design“, with each object fulfilling a “pattern of relationships” that connects with others. For me… its a language I can begin to use to translate my research on natural system designs into, into “JPL” (aka Jessie’s Pattern Language), for subjects such as how natural systems transition from “type-r” to “type-K” behaviors (a subject underlying much of the discussion on RNS of complex system successions,life stages and cycles,”dual paradigm views”, “organizational stage models”, as observable patterns of organized change in relationships).
The reason it works for “object oriented” programming and “natural systems science” and in other areas too, appear to be the same. Pattern languages let people use their considerable natural understanding of complex relationships, like “home” “friends” “communication” “trust” “patience” etc. to open our eyes to similarly complex working relationships and meanings of complex systems elsewhere too, as “designs”. The standard “design pattern” of pattern languages connects human relationship concepts to working organizational relationships of behavioral systems of ANY kind. That seems to be why the design model that Alexander invented turns out to be so adaptable to our needs in our now overwhelmingly complex new world…! ;-) I can see it readily becoming applied to breaking down the silos of separation between knowledge disciplines, too, the so called “blind men and the elephant problem”, something just completely unimaginable in reality today.
Pattern Languages are for
1. identifying key organizational elements in systems of complex relationships, found in nature or in design practice,
2. communicating design elements for complexly organized systems or illuminating them in existing natural or manmade ones.
3. using the design pattern to refer back to the original natural forms and contexts from which it originated or is used to represent.
Two natural system design patterns, (for example):
Moving with the Flow
 Sometimes you watch the people, sometimes their flows. The flows are roles in larger scale systems of group motion, forming as people avoid interference, but can confine them till they find an opening too. Markets flows form paths and break from them as new paths are found, often flocking in chase of a wave of anticipation, or uncertainty moving leaderless floods. Those are puzzling, since there may be no news the contagious change in direction, but systemic change generally usually has a real cause. Flocks of birds appear to do it just for fun though.
Alternating roles that Fit
 Both natural and human designed complex organizations have independent parts that create emergent properties by fitting multiple roles. Day and night, male and female, work and relaxation, pencil and paper, cup and liquid, all the amazing polarities that produce reliable results because of how they fit their multiple roles, quite unlike any set of fixed rules could ever do. The trick is only physical parts and their relationships can do that, and a pattern language those relationships provide a way to develop concepts for understanding the working parts.
There are many types of Natural Pattern Languages, generally depending on the organizational medium (material and environment)
- Social organization pattern languages
- Natural system pattern languages
- Architectural and Urban design pattern languages
- Cultural pattern languages
- Abstract Scientific pattern languages
- Educational pattern languages
- Computer knowledge design pattern languages
- Commons & community design pattern languages
- Economic pattern languages
- Movie making pattern languages
- Organizing pattern languages
- … etc.
There are three uses of the term “pattern language”,
1. As the collection of design elements and patterns used to design or describe working complex systems
2. As an the organizational language of an individual design project describing its working relationships as a whole
3. As a property of an individual complex system, consisting of the working relationships between its parts and its environment, that might be view from various perspectives to recognize different elements.
So they’re simple conceptual models designed as versatile tools for engaging our minds with the actual working organization and relationships of natural and designed complexly organized parts of our world. So they come in those two basic forms, as Design Patterns one uses to guide the implementation of some plan or as Natural Patterns used to help people understand how designs can fit in with natural organizations.
Pattern Language sites
- The Christopher Alexander site
- The Hillside Group Pattern Site
- The Hillside Pattern Collection reference list
_____________________
jlh