
The problem that Scope-4 corrects:
Today our measures of business environmental impacts address the size and efficiency of business technology use, traceable from local business records. We’re not even trying to measure what’s traceable from what a business pays for throughout the whole economy. So in effect, the global impact is counted within a narrow local boundary, making the measures scientifically undefined, and highly misleading. Why it matters is that business, investor and policy decision makers then don’t know what impacts their decisions really have, and the research says most of any business’s real impacts are global. So we need to understand why the world economy seems to work so smoothly.
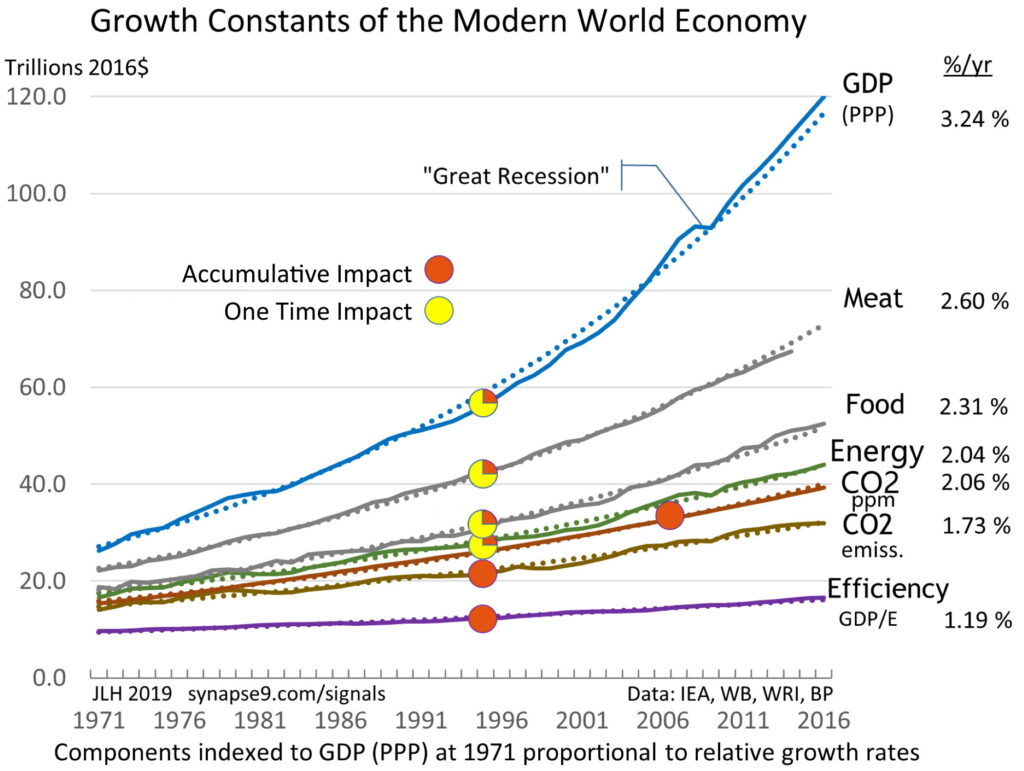
The world economy grows as a whole, as if all parts worked smoothly together, shown since 1970 here, and seems to have for 150 years, hard to imagine but competition seems to assure it, at least for energy use.
What’s counter intuitive for solving it is that the world economy not only LOOKS like a whole system, it also WORKS as a whole system. What you know is 1) all parts of the economy are supposed to be and 2) seem to act as if 3) they are competitively efficient. Otherwise 4) they lose their access to energy use, and the energy goes to someone else. Smooth working competition like that is 5) needed for a world system to work as smoothly as global data shows, and 6) making there no better assumption than that differences from global average efficiency are temporary. So unless someone can say why not, I think we have to treat energy use as being predictably proportional to GDP. That’s been peer reviewed as a general principle, that one can rely on the range of local or international variations being likely to be relatively small (maybe +/- 10%) for any globally connected part.
so…. there’s a LARGE miss-match
between the effects we see and the ones our money really causes
____________
Introduction –
the scientific basis for the SEA-LCA “SCOPE-4” accounting principle,
| That: Every dollar spent can be shown likely to pay for such widely distributed services throughout the world economy, that at least as a first assumption, it also pays for an equal share per dollar of the whole world’s economic activity and impacts. In principle, shares of GDP seem to carry equal shares of responsibility for what the economy does to produce GDP |
Only if that presumption is part of impact assessments, for ALL dollar costs of every sort, will business impact accounts reflect the full environmental impact of a business’s decision to operate and so also its exposures to financial environmental risks. That total accounting of environmental impacts are part of what business’s decisions cause, whether known or not. So they need to be reflected impact assessments for a business for it to know what impacts it is making decisions about. Those impacts have previously been recorded, but *in other untraceable accounts*, the accounts of the other businesses also paying people to deliver the products that someone else’s consumption pay for. Making impact decisions not knowing what impacts a decision actually pays for has been giving sustainability decision making highly misleading information. The most critically important way that matters is that:
standard sustainability accounting today can show business impacts in decline while a business has its total impacts rising faster and faster.
just by failing to include the paid for, but unrecorded, human consumption that is needed to operate the business, the businesses of its supply and services chains, and the various other support, financial and government services it uses. The surprising reality is
those overlooked direct environmental impacts of creating and using the wealth of a business are often 50% to 90% or more of the true total.
__________________
Notes:
1. Examples and links
- Simpler introduction: Easy Intro, “scope-4″ use & interpretation
- Global application, an information system for connecting our common interests and choices, a “World SDG“
- The research paper on which the accounting principles are based, Systems Energy Assessment (SEA)
- Appendix I. GHG’s of $500 airfare or a painting II. Comparing I/O-LCA & SEA-LCA
2. The occasion:
I attended a remarkable meeting of UNEP and Wall Street investing experts at the 7 WTC offices of MSCI, led by “2 Degree Investing “. Business is just starting to react with appropriate alarm to the wave of climate change risks for their businesses and investor portfolios, and the metrics community is rushing to turn the various models for impact metrics into true financial measurement tools. The tangled complexity of the economy and environment and how both are dangerously changing… are what gets in-between, raising the challenges and the stakes.
No one wants to be compelled to change as fast as the science makes clear is needed, to escape the severe harm from climate change and its economic effects. We also have rising societal needs and other impinging harms from degrading and depleting our resources of many kinds, all caused by the mysterious “externalities” of how businesses operate, that people are largely unaware of the financial consequences of. Several advantages of my SEA “Scope-4” whole system metric came out, designed to force all the hidden impacts of a business to come out of hiding, by “dividing up” the world’s totals rather than by “adding up” traceable parts.
The latter makes it easy to overlook the greater share. So as a scientific problem it becomes “how to measure a glass half hidden”. First you need to sense “something’s missing”! I found it easier than expected to understand and communicate, I guess because this whole group was struggling with the same enormous set of still undefined problems. It’s been a mystery why so much discussion of the economic hazards ahead hasn’t led to world business responding, given how clear the problem developing seems to be. So I personally had a great time, finding my insights fitting in with others, much better than in other discussions is seemed.
That we’re facing a convergence of interacting crises, not just one big one, is part of what I added, as well as pointing out that our metrics allow business to “eliminate” environmental impacts by moving them to undefined categories….
The following is an edited version of my letter to a speaker presenting the GHG Protocol and World Resource Institute work on defining of its “Scope 3” method of accounting for a business’s whole economic GHG impact, that my “Scope-4” is in some ways “competing with”.
___________________
Why All the tiers?? –
– A business product & its product and service supply tree. – At each step money is pulled along the branches to the better choice of supplier, for the product or service needed, flowing to the tips of the network a bit like water is drawn up a the branches of a tree to a tree’s leaves. For an economy’s service tree, the “leaves” are “people” paid for their know-how.
When we talk about measuring impacts,
…every measure is an “imprint” of a real world economy that will be mentally hard to connect. It helps a lot if a group of people seeing separate parts of an elephant, as a result, are all raising questions about the connections rather than arguing!
At MSCI yesterday the range of experts on a dozen different sides of the financial issues had one remarkable thing in common, asking really interesting questions, covering very broad topics with some detail and specificity, in a quite surprisingly clear and lucid way. One humorous note arose when the two very different ways of measuring a business’s whole economic GHG impact, the GHG & WRI “Scope 3” and my SEA-LCA “Scope-4”, were verbally described with the exact same words, even though they measure very different things. ;-)
I think the answer is that each different well designed measure will highlight different points of influence, with some measures better for one or another purpose.
Scope 3 uses conventional economic data, a big benefit, and is particularly good for directing attention to high concentrations of GHG impact, for example. Those are candidates for direct regulatory and publicly funded technology interventions.
The strength of SEA “Scope-4” is being designed to account for whole business impacts as shares of responsibility for the economy’s impacts as a whole. Despite using a less developed field of analysis, all the parts of business decision making and the organization of the business as a whole are included, which “Scope 3” doesn’t do.
Particular strengths of SEA and “Scope-4” would be for:
- guiding general consumer and investment market decisions
- exposing the diffuse “fat tail” that is responsible for most business energy use,
- allowing separate measurement of a business’s own impact (tier 1 operations and services)
- and its accumulative global impacts (tier 1 + 2,3,4 + as a share of the economy’s total).
- being easier to use and more accurate for scale, combining estimates with less precision.
The weaknesses easy to see:
- tasking both the public and professional understanding of complex economic systems
- needing new popular language development
- needing new studies of supply and service chain distributions
- Even though the SEA “Scope-4” approach is scientific, and simple to define, it also raises lots of unfamiliar questions worth discussing.
| combined tech & human consumption |
| Business Unit impact = Tier 1 Accumulative Impact = Tier 2,3,4… |
- What are whole systems?
- Why is it misleading to count only the impacts you have data for?
- Why think of businesses as the organizational units of people and their machines?
- Why count “end product impacts” as the “consumption of all the people paid for delivering them”?
No 3 and 4 are the big conceptual differences. Instead of treating businesses as numbers in accounts, businesses as treated as the whole organizational units of people matched with their technologies that create economic value. That’s what we want to measure and optimize for sustainabilty. The end product producing unit is served by long chains of producer products and services, with 100% of the end user’s sales price ultimately being passed through a vast array of businesses to people for their own end user consumption, as end producers.
I think its an accounting tautology, that money debited for a person becomes money credited to another person, to be used for their impacts. For the research paper we defined rules for the assumed distributions and for a method of combining material impact measures from the technology chains with consumption impact measures of the human consumption, both needing more study. What’s important about the consumption impact distribution is how very widespread it is, implying “average” is a good estimate.
In the supply chain diagram above an end product is shown being delivered by a business employing groups of businesses (Boxes & Lines), that are using products and services of four other groups of businesses each with groups of employees as end producers (Green Dots & Lines) . So in Tier 1 4 groups of people receive parts of the purchase price as as end recipients, using the producer product or service of 16 groups of businesses. Then in the higher tiers there are:
- 16 end producer groups paid in Tier 2,
- 64 end producer groups paid in Tier 3,
- 256 end producer groups paid in Tier 4 and
- 1024 end producer groups paid in Tier 5…
If each group was 10 businesses with 50 employees, and employee wages are 1/4 of business revenues, then at Tier 5, ~70% of the end product sale price would have been distributed to ~682,000 people, still leaving 30% of price to reach its end recipients. As every group of people receiving money from their business would have widely distributed life styles, and all consume a diversity of all the products of the economy, that it would be “average” consumption seems likely.
In any case… the need to study end consumer impacts is “why the accounting is taken to to the end of all the tiers of end producers”…
To the financial community, this “biophysical economics” view is such a new approach, using systems physics principles, and studying organization rather than budgets, it needs to be patiently explored and discussed. So I’d encourage you to frame some of your own questions and if possible arrange a discussion.
Gary Buesser of Lazard Freres readily understood it, though, as I framed a question for him yesterday. I described SEA “Scope-4” as including the usual life cycle energy demands of the physical plant and technology, as LCA does, combined with the estimated the life cycle energy demands of every other expense on the business balance sheet as well. I think that inclusiveness is part of why our early 2010 version of the paper won the ASME “Best energy paper of the year” award.
We developed separate rules for assessing the unique energy impacts of every type of business costs, business services, consultants, employees, pensions and medical, management, taxes, financing, land costs, licenses and fees, etc… Gary seemed to think what we found that way was quite reasonable, that the energy demands for that added list of items on the wind farm’s balance sheet was four times those for the physical plant and technology.
My question for Gary was, “Would having that more complete estimate of direct GHG responsibility help clarify the financial exposure to GHG risks?” His response was “very telling”. He offered a nice example of how he’d go about looking at a business’s technology options…, in effect saying he had just never thought about how any other business decision affects the business energy demands on the economy.
So one important effect of SEA “Scope-4” would be giving investors and business people the information that:
would turn their attention to the business as a “whole system” and to the decision making of all kinds that affects its risks in an whole economy of now growing risks of many kinds.
Because many parts of the answer are that are largely unstudied, one needs to rely on the scientist’s and experienced estimators’ trick, that of including unknowns in the analysis, using what look like tentative estimates. It creates a place to record questions that need to be studied, to provide place-holders in tables and equations at first, to assure others will be challenged to keep reassessing what they represent till the best available information is found.
The pie chart and table for the model study looked like these:
For further background have a look at the research paper, the discussion and slides on the reference site. The technique involves having a way of combining direct impact measures with implied ones, using fractions of GDP as representing responsibility for fractions of GDP impacts. It relies on the stability of “large averages” “for the whole system”, that provide a fairly broad rationale for measuring impacts with money .
I also developed an interesting conceptual application, a World ESG balance sheet and SDG “dashboard” to start the process of comparing financial balance sheets with comprehensive ESG balance sheets. As with SEA, particular impacts and impact costs to society would be reported along with implied shares of responsibility for diffuse impacts, the basic principle of SEA style metrics. That would integrate GHG reporting with the whole array of other measurable impacts, such as CDP is talking about. I think I’ve done enough to define the accounting concept fairly clearly.
Given I’ve had so little difficulty raising these issues was clearly in part due to the amazing group of thoughtful people, all struggling with much the same thing. In some way I think it must also be evidence that it’s time for a multi paradigm approach, to take hold.
Everyone seems to be getting the idea that “the elephant” has multiple parts… !
++++++++++++++
Appendix I
“Let’s say, in a carbon tax world, I am trying to decide to buy a $500 airplane ticket, or a $500 painting at the local art gallery, why would the carbon tax the same for both?“
The GHG’s for $500 spent, as airfare or as a painting
The question shows we’re not yet really asking what intensity factor to assign to each, that’s what Scope-4 is about. Every expense in anyone’s personal budget will have some CO2 impact, from paying people to provide the services involved. To start from that comparison, though, the problem is you can’t get information on where the money goes and what others use their shares of it for. That problem allows a good solution, though. It means you both need to also can (conditionally) rely on the large averages of what people do with money, rather than counting up individually traced energy uses you have no information on anyway.
- The $500 plane ticket will pay for all the things an airline does,
- with only 35% going to the purchase of jet fuel, $175 or ~58 gal at $3/gal.
- That is ~560kg CO2 impact, or .560 tonnes
- The people who delivered the 58gal are actually the ones getting the money and
i. spending that part of your ticket price to support themselves and obtain and deliver the fuel to you,
ii. so that’s the “energy cost of energy”, that has two parts, a fuels used and services used
iii. Having studied it I’ll guess
- the fuels part is ~10% and the services part is ~90% of “world average intensity” per $,
- 10% = 56kg CO2, World CO2/$GDP Average ~.45kg/$
- 3. Total = 56kg + .45kg*90%*$175 = 127 kg
- Doing it also for the rest of the ticket price
i. Using 90% of world CO2/$GDP and the balance of the price $375
ii. $325*.45kg/$*90% = 132kg
- For a total of ~560kg + 127kg + 132kg = 819kg CO2 total
i. The total is 3.6X average CO2/$
ii. And 560kg (for the jet fuel alone) would have an error of 259kg (or 46%)!
- The $500 painting would be simpler,
- As not involving any measurable energy we would rate it as having 0kg CO2 impact
- The money would go to the average uses of the person or business receiving the money, though.
- Lacking other information you’d assume the normal use of money for diverse kinds of spending
i. Again, I won’t use “average” ( .45kg/$ ) but 90% of average for normal consumption.
ii. $500 * .45kg/$ * 90% = 202kg CO2 total
iii. The initial ‘0’kg CO2 estimate would be have an error of 202kg (infinity%).
- 3. The weird things are,
- a. As most everyone will have expenses of various intensities
i. high intensity (like 3.6X)
ii. and normal intensity (like .9X) for general consumption, and
iii. low intensity (like .4X maybe) for purchases from ‘off grid’ communities maybe?
- b. Any dollar you don’t spend on one thing gets spent on or invested in another
i. So there are two ways to reduce your CO2 impact
ii. One is by earning less
iii. The other by using it for influencing the world
- c. So maybe how the calculation matters
i. Is that 819 kg CO2 for the flight may be more than the 202kg for the painting
ii. But those are taken out of context, and don’t tell you
iii. But which choice would more change the world, and in which direction?
iv. So I think you still need a way for everyone to know what would be better to invest in.
v. (Back to line 1)
It has taken a little effort to get there, but as any money spent on one thing is going to be transferred to spending or investment in another, the question is really how you make use of your whole income. It’s in how you use your income to change the thinking of your community, the purposes you devote it to like helping others understand where money goes, sharing your willingness to take responsibility for your impacts on the whole. It’s really quite remarkable what our individual shares of world GDP add up to in uses of the earth. I live in New York City, earning ~2% of world GDP and both by the exhaustive math, and on principle, then as for Sustainable Cities needs to hold itself responsible for the same ~2% of mankind’s consumption of the earth.
Appendix II.
Comparing “Scope-4” with advanced environmental I/O LCA methods
So, I know of nothing wrong with the I/O accounting (for measuring material exchanges between economic sectors). The problem is the definitional exclusion of environmental impacts of human services, throughout the business value chains. Below are a “value tree” diagram and a comparison table to help, and bring out more issues for further research. In the diagram the human services are symbolized by green dots, the money from business revenues going to people, versus other businesses along the tree.
For impact accounting you need to add up all producer inputs in an individual business value tree. It seems to be the same as for cost accounting. If your cost accountant arbitrarily removes what you spend on taxes and stockholder distributions it seems to improve the balance sheet, but how you price your products might be too low. The value trees produced by I/O transfers are of average transfers between sectors, not an individual business case, and locate the impacts for employee consumption in different sectors than the business, so the impacts of the individual business as a whole can’t be accounted for. You need an individualized business impact assessment to respond to its individual financial risk exposures. As the individual tree actually has billions of different inputs, it would be uneconomic to individually account for them though. So there’s a trade-off between getting the scale right and getting the answer precise.
SEA is designed to statistically fill in missing information statistically, so the end user consumption paid for by a business are shown as impacts of the business. The accuracy for scale depends on whether the total of assessed impacts for components of GDP turn out to be equal to the total impacts of the economy. Once a business’s total assessed impacts match its share of the total for GDP, then you can be more confident about the relative importance of the value chain parts. The performance of different parts of the value chain might matter for how businesses respond to a GHG tax.
A GHG tax could charge a fee to either by 1) businesses, 2) consumers, 3) investors or 4) fuel suppliers, or different fees for each. In any case, normal financial risk to investors would come from increasing costs in every part of the value tree for their investments, raising prices for business consumers and lowering consumer demand. With SEA, the accounting increase for starting to count the use of human services and paying for that end user consumption as a cost of production and business impact, would be very widely distributed. If the direct tax exposure for a GHG tax on business would be first for their total accumulative embedded GHG’s, to be reduced by the GHG tax already paid or discounted by others in the value tree.
How SEA statistically fills in missing environmental impacts is by assigning an intensity factor (Eii) for business costs with untraced impacts. For the SEA paper 90% of average Energy/$GDP was used for employee and general business expense costs. (It was an estimate of the probable spending on consumer products drawing on I/O sectors not included in their business sector’s producer products.) Why consumers might by products mostly from other sectors than they work in is simple. Employees of a steel plant mostly don’t by steel producer products when they shop. They go to Walmart, pay their mortgage, drive their cars, educate their kids… etc.
Those are direct “consumption for production” costs to the business that pays them for bringing their talent, organization skills or ownership rights to the operation of the business. They’re also direct environmental impacts not being counted by either process or I/O LCA methods. The Eii = 90% is such a general guess, that’s one of the first things others would need to validate by making their own estimates. Perhaps the modern I/O models have improved, so the general estimate might be %60 rather than %90. Perhaps they have data determining intensity factors for missing inputs for every sector already. My assessment seem mainly definitive, though, on human services being business costs that have environmental impacts being left out of the economic analysis. What I’d like the people who did the basic science for the Carnegie Mellon I/O method, or someone recommended by them, to take on the problem as an interesting challenge and begin the research needed to make financially reliable “whole system assessment” generally available.
_________
The table does not say more than the descriptions above, but records a comparing the outputs of the two methods
| I/O-LCA method by Carnegie Mellon v. SEA-LCA method by Jessie Henshaw et all. |
| Business cost sector | 2002 kWH/$ | note | |
| SEA-LCA kWH/$ | I/O-LCA kWH/$ | ||
| World Economy average energy intensity | 2.76 * | 2.76 * | IEA World statistics – kWH/$ world average * adj. to 2002 values from 2006 values [inflation – x1.12, GDP energy intensity change – x1.1] |
| “human services” intensity (for operating, organizing or owning businesses | Est. 90% of avg. 2.48 ** | (undefined) Assumed 0.0 | I/O-LCA (omits human compensation impacts) |
| Model Wind Farm for SEA-LCA v.1 study | Energy Produced 13.4 | Energy supplied & Total Energy costs, per $ sales (energy/$ used counting energy for human services consumption) | |
| Power generation and supply | Energy Produced 108 Used 3.78 | Energy supplied & I/O-LCA Energy costs, per $ sales (energy/$ used not counting energy for human services consumption) – likely more accurate to then add 90% of world avg intensity for the human services costs throughout the supply chain, adding 2.48 kWH/$ for all costs ** | |
| Non res. commercial construction | 8.34 | more accurate if increased by 2.48 kWH/$ of costs? ** | |
| Elementary and secondary schools | 1.71 | more accurate if increased by 2.48 kWH/$ of costs? ** | |
| Management consulting services | 5.54 | more accurate if increased by 2.48 kWH/$ of costs? ** | |
** to count impacts costs of human services employed by a business, an impact intensity of 90% of average world GDP impact intensity is used. It allows for ~90% of the consumption of people being paid as coming from OTHER economic sectors than the business employing them, and so in addition to what that business can account for.