Re: 18 – 21 Oct 2016 Addis Ababa, Ethiopia (research ref’s at the bottom)
Fourth meeting of the IAEG-SDGs
SD indicators need one more, the World SDG
so Innovators can design their goals
in relation to the whole
My comment is as an expert on both system design and natural science indicators, on how innovative organization develops in both natural and intentional complex systems. There is a great depth of professional design practice that has yet to be consulted regarding the plan for the SDG’s
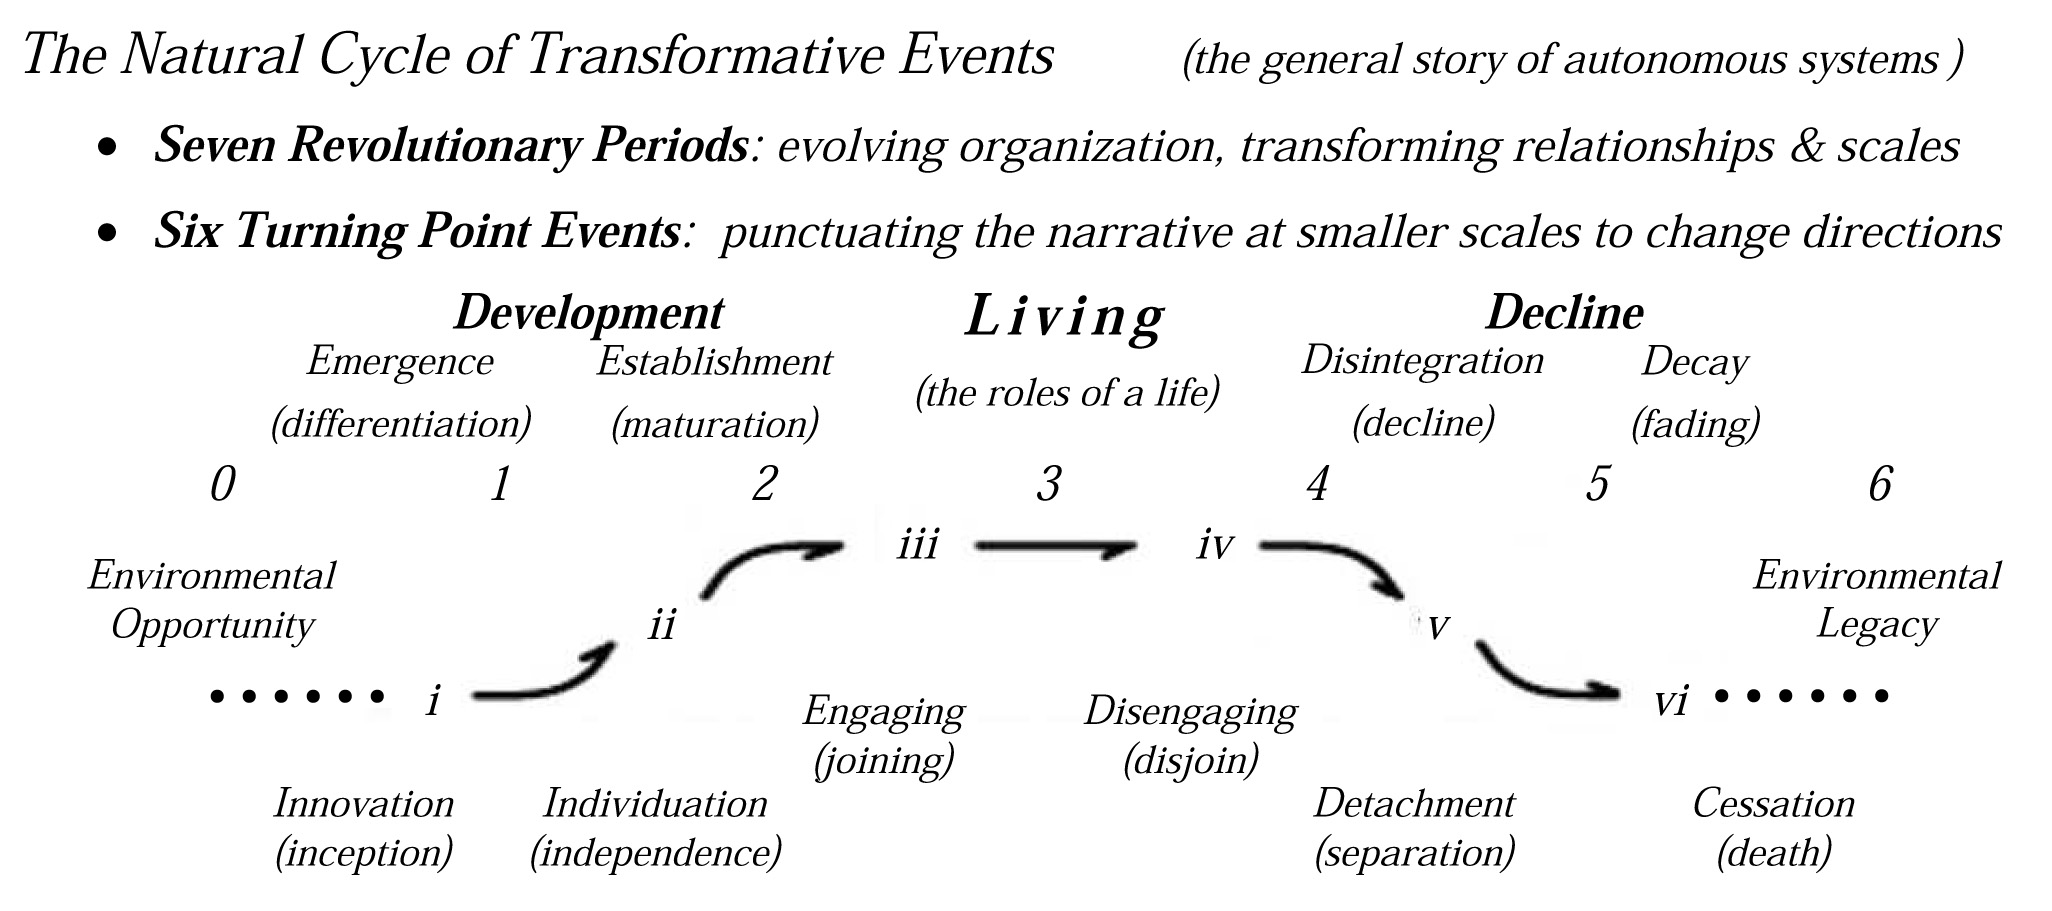
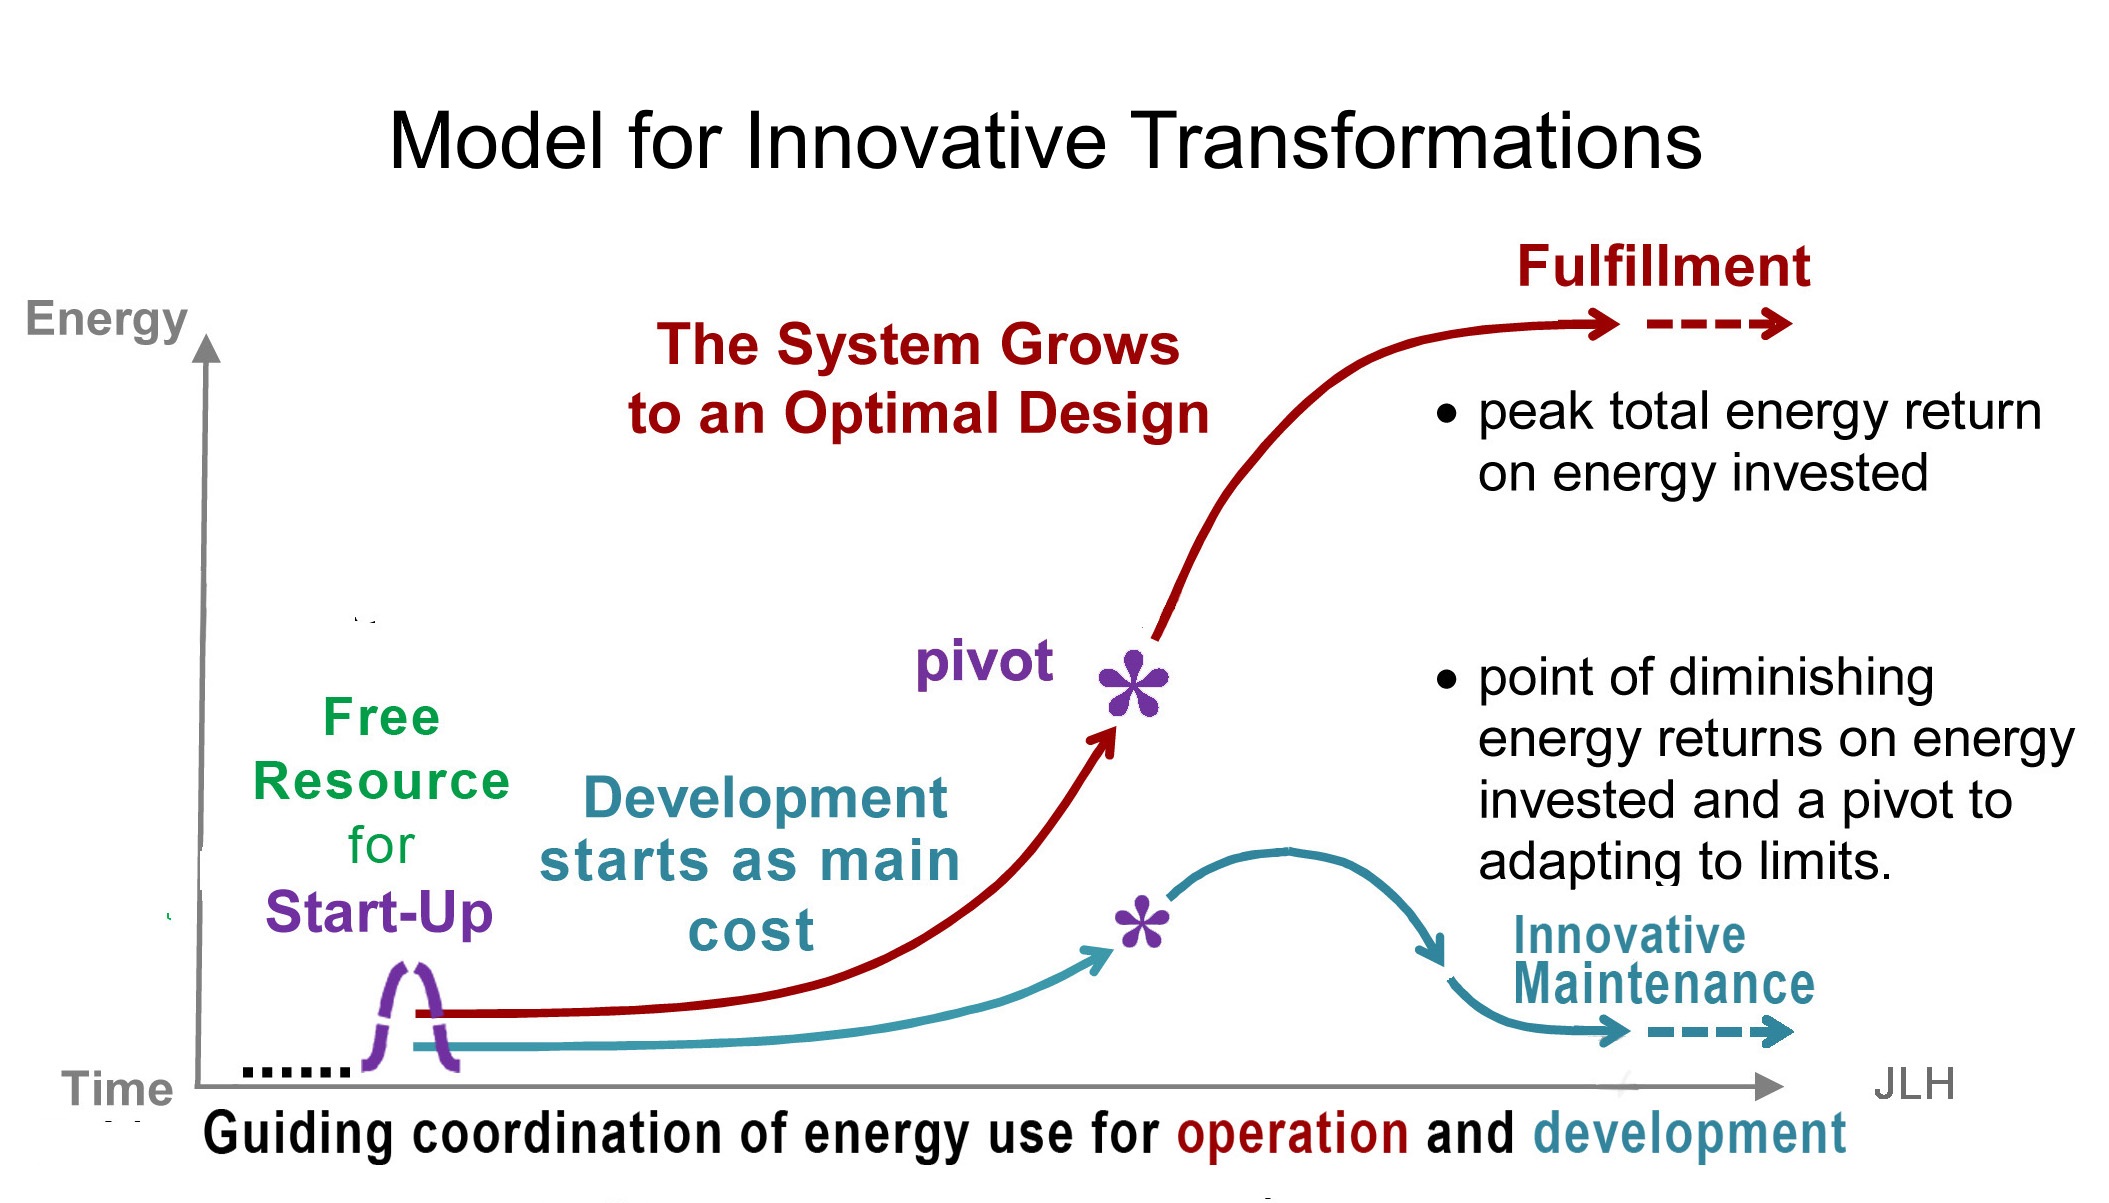
The general model of innovative transformations is that the emerging culture change, starting from some “seed pattern”, and then going through the classic phases of their own life-cycle of internal growth and changing roles in their environment (fig 1). There are of course many kinds of invasive systems and life-cycles. The type we are most often concerned with innovative transformations of human design, whether our own educations, or our society’s struggle to become “sustainable”, succeeds or not.
The earliest visible pattern is the emergence of an “inspiration” or “design”, looking for an opportunity to take hold, to have a starting organization that gets going by using environmental energy for building up the design. That energy flow for formation then tapers off as the transformation progresses, toward refining the “new capability”, or “new culture” or “new business” etc.
The natural goal is generally to stabilize the design as it begins its real work at a peak of vitality, beginning a long productive life. So in general, it’s to first grow and then make a home, to have a life. This model developed from study of natural change patterns , applying constraints of physics principles for energy use, that for designs to develop or change they need to develop new energy uses too.
I’ve been attending the UN SDG meetings for four years, first for the Institute for Planetary Synthesis, and then with CIVICUS, learning a tremendous amount, but also noticing the very distinct lack of systems thinking in the design of the SDG’s. The main reasons seem to be that systems thinking is not taught in liberal arts educations, and that the design of the SDG’s was mainly shaped by demands for change, by issue focused groups from governments and civil society, not experienced with how organization relies on designs to join differentiated parts. So ideas of how to organizing the differentiated parts when undiscussed and were mostly left out.
So the process produced 17 idealistic “goals” and 36 main “topics” discussed mostly separately, arising from a profound concern with the whole global pattern of culture change and economic development. Personally I had a wonderful time, but was also sad I never got to talk about my main expertise, i.e. on how the parts of whole systems connect. From a natural systems view the SDG’s may be spoken of as separate, but are all indicators of “holistic cultural growth”. They’re not really indicators of “economic growth”, as it’s whole culture growth that brings value to an economy not the reverse.
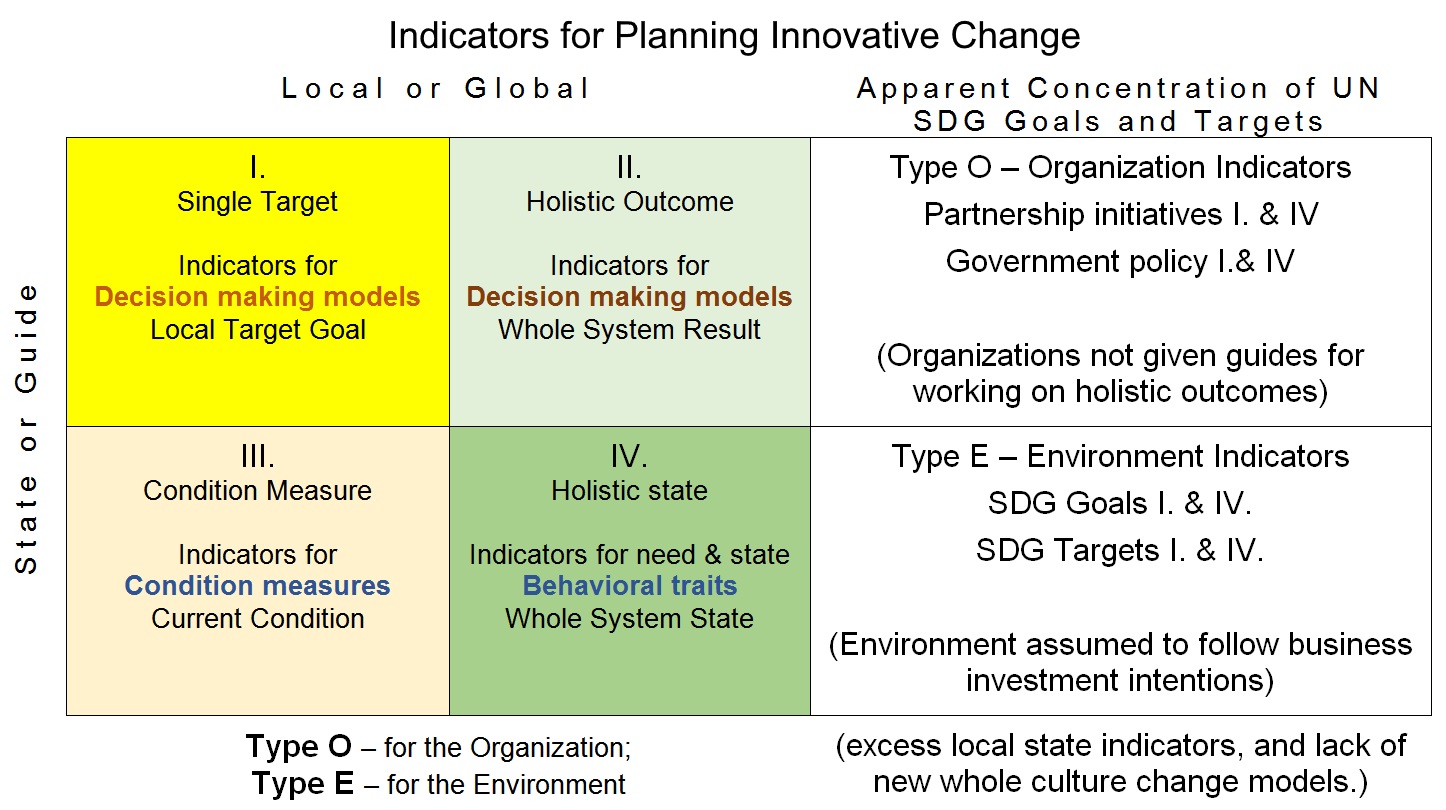
With the process lacking systems thinking resulted in missing systems indicators: for how differentiated parts connect, for how cultures develop unity and cohesion. The diagram below is mainly for study, a “sense making tool”, a “map of questions” to help guide innovative changes.
The challenge is our usual mental confusion, with our minds working with disconnected bits of information and but actually working in holistic organizations and trying to engage with holistic systems of our world. So our “maps” and our “worlds” show a “mismatch of variety”. So we need to constantly study and learn from new experience. To succeed with an SD partnership, the organizers first need to find a “start-up match” between its “own abilities” and “an environmental opportunity”. Usually it takes “a study of the context”, identifying “forces to make whole” with a “unifying response” ( a reference to “pattern language”) . In terms of the 8 kinds of indicators for planning change, it’s matching type IV indicators of whole system potential, one set within the organization and the other in the environment. The actual initiative might focus on one or the other…
The 4 quadrant map has “condition indicators” for “states” (how things are) and “guides” (what can change). It has “context indicators”, “local” and “global”. The four quadrants are repeated for the Organization and the Environment as a 3rd dimension for the array. This arrangement borrows a bit from David Snowden’s Cynefine “place” centered holistic complex system business design practice. It fits with the long lists of indicators of functionally different kind needed for the SDG’s
There are also other advanced holistic system design traditions to choose from. In all of them design proceeds in “stages” of team “learning”, “work” then “review”. With each cycle all the indicators being worked with are reviewed. All the indicators the organization uses to guide it are consulted in the learning phase of each cycle. The architectural, product design and performance design professions have ancient traditions of how they do their work. Newer traditions of system design where this kind of learning is studied include “action learning”, “pattern language”, “object oriented design”, and “permaculture”. None of these traditions of advanced design practice seem to have been consulted for the SDG’s for some reason.
I do hope the above is helpful
for where SDG implementations can go for advice.
My real reason for writing, …and offering this way of understanding transformational change,… is the oddly disastrous pattern of excluded indicators in the official statistics for the SDG’s. The measures of ESG impacts that businesses are told to report as measures of their responsibility, have many more exclusions than inclusions.
It is possibly unintentional but oddly very boldly “hidden in sight”, the clear exclusion of all responsibility for the disruptive impacts of business and investor money decisions. It comes from the modern continuation of the ancient practice of excluding all business responsibility for economic “externalities” of the choices for what to profit from. Some impacts of what to profit from no one in the past would have know about. Now we really do know most of them.
The very largest exclusion from business impact reporting, though, is one that anyone would always have known about. It’s all the human consumption that business revenue pays for to obtain human services, ALL of it, as if those impacts had no environmental cost. That one accounting exclusion is commonly five or ten times the impacts the rules say businesses should count. The indication is that we have not started doing any form of sustainable development yet, systematically making decisions as if 80-90% of the impacts don’t exist.
At the UN and in writing to people I’ve been finding most people understand all this fairly quickly, …but then avoid engaging in discussion, the worst of all possible responses for our world. The cover-up and avoidance is always the bigger crime.
I urge you to respond to the challenge.
There’s a simple way, too,
include in SD reports one new indicator, “global share of GDP impacts” proportional to share of global GDP
It’s really important to start the discussion.
Thanks for all your dedication and work
Most sincerely,
Jessie Henshaw
______________
The next more detailed introduction,
to the “mostly uncounted” SD impact indicator problem, with references.
fyi –
I’m writing as a scientist, and expert on the design of natural systems and natural science indicators. I had wanted to attend the Ethiopia EAG meeting on Indicators, due to the major neglected issues I need to raise. Not having a sponsor I thought to pass on some of it to others who may get there. It’s about reliable filling the unusually large gaps in the SD impact indicators used for decision making.
As a consulting systems scientist I’ve has been attending UN meetings for four years, observing the SDG process, and noticing the big gaps in systems thinking being built into the plan. One in particular is that our impact measurement methods are not holistic, but actually quite fragmentary. Just having better information on visible impacts won’t tell us about the growing system-wide impacts, so SD decisions will still be unable to avoid traditional pitfalls of economic planning. Going ahead with just fragmentary indicators could really then make the SDG effort backfire, perhaps badly, adding to the “externalities” of the economy not reducing them.
That we are not yet doing holistic impact assessment is fairly easily documented, as whole categories left out of the accounting. There’s an amazing list of things the economists (at the direction of the OECD it seems) have arbitrarily left out of the list of things to count. The peculiar result is that the exclusions add up to nominally 90% of the real total. The biggest category of exclusions is usually the largest category of business environmental impacts. It’s the impact of paying business people for their human services, and for professional services, financing and public services. As a result SD decisions to maximize profit are being made unaware of nominally 90% of the future impact costs of those decisions. It’s surely a long standing habit we can’t change all at once, but we desperately need a recognition of it.
The economists have historically counted the business impacts as only things the business specifically directs. That then treats the “consumption for production” of human services as having zero impact, the usual largest of costs and of lasting environmental impacts of any business. The same is the case for all other supply chain impacts that are packaged as “services”, all counted as having zero environmental impact.. Having so little information on the lasting direct costs of business profits has always been a problem, and when combined with not feeling responsible defining “business as usual”. Today SD decision makers are still trying to maximize returns with a similar lack of information, though, as if just feeling responsible would compensate for the misinformation. It doesn’t.
I think most important is not to pick fights but to raise discussions of our common responsibility to address our common interests, to begin to include ones we’d been blind to. The caution is that It’s common for people whose sight is suddenly restored to be in shock, so it’s caring for them not making demands that lets them see.
If you or others would like to follow this up, you might start from watching my video comment to the UN on July 11 (1), and read the short “Impacts Uncounted” circular (2). I found it very effective for explaining the details when talking with people at the UN. There’s also a quite surprising scientific solution that makes holistic accounting possible, first reported in a peer reviewed 2011 paper (3). How to use that principle that “shares of the economy are directly responsible for shares of its impacts”, because of globalization, actually, is shown in a general 2014 proposal to the UN called the “World SDG” (4). It’s not getting discussed much yet, apparently due to the shock. Another caution, of course, is that we need the old economy to build the new one, part of why transformations are complex.
The big mental shock seems to be realizing the lasting impacts of using money are not close to “zero” at it appears. They’re actually very likely close to “average”, for being so unusually widely distributed the way an efficient economy works, that to do most anything takes everyone’s service. That “reassessment” is an almost infinite change of scale in our responsibilities, after all. It directly connects what we do innocently with money with all the disruptive things the economy increasingly does as our growth model collides with the limits of the earth, ..hurting the distressed communities the most.
So what we need is for people to keep doing what they’re doing, and begin to assume they have a real responsibility for what’s going wrong with the economy and the world, in approximate direct proportion to their share of the economy.
I hope that connects with your thinking and gives you a start with mine. Please send me anything you think is relevant.
Good luck your good work! Thanks so much for your time.
- JLH at UN HLPF – comment on Growth & Impacts Uncounted, 11 Jul 16
– https://www.youtube.com/watch?v=CxSmEixz5WQ - Impacts Uncounted circular
– http://www.synapse9.com/_SDinteg/ImpactsUncountedl.pdf - Henshaw et. all. 2011,System Energy Assessment (SEA). Sustainability 2011, 3(10)
– http://www.mdpi.com/2071-1050/3/10/1908/ - World SDG proposal
– https://synapse9.com/signals/2014/02/03/a-world-sdg/
JLH