
1 The End of Crack and Breakout of Hip-Hop
2 The US economy’s separate tracks for rich and poor
To help people understand my work, here are a couple of examples of data science to discover dramatic recent culture changes in New York City. The work is based on a careful lifelong study of eventful natural change, of all sorts, done by following the stages of growth and decay evident in the natural life cycles of culture change events.
following the stages of growth and decay evident in the natural life-cycles of culture change
My method depends on finding data that shows clear evidence of growth or decay, as those identify natural processes of irreversible organizational development, in the natural successions of change. Below are samples from two advanced studies of unexpected dramatic societal change, and a drawing of the markers of change I use to suggest what evidence to look for to discover what’s changing.
The two advanced studies are the mysterious 1991 collapse of the great NYC crack culture (1), and second, the mysterious 1970 splitting apart of the US economy into rich and poor sectors on different tracks (2). Both were simply enormous cultural events that very largely went unnoticed, dramatic “break-outs” of culture change that had been brewing for a long time, and then swiftly changed how we live. The study of the collapse of the NYC crack culture and many other examples are in the archive of my research from the 80s and 90s called “The physics of happening”
It gets easier to discuss these cultural changes once you sense what is being opened up to view is really the stories of our own lives. These and patterns of change in things we are all talking about anyway, only with data showing the systematic progression of key measurements of them. The basic science for following markers of change, implied by the physics principle of energy conservation (3), implying that lasting change is a process of organizational development. So the markers suggest places to ask “what’s developing”.
basic science for following markers of organization change, implied by the physics principle of energy conservation
the markers suggesting places to ask “what’s developing”.
1.
The End of Crack and Breakout of Hip-Hop
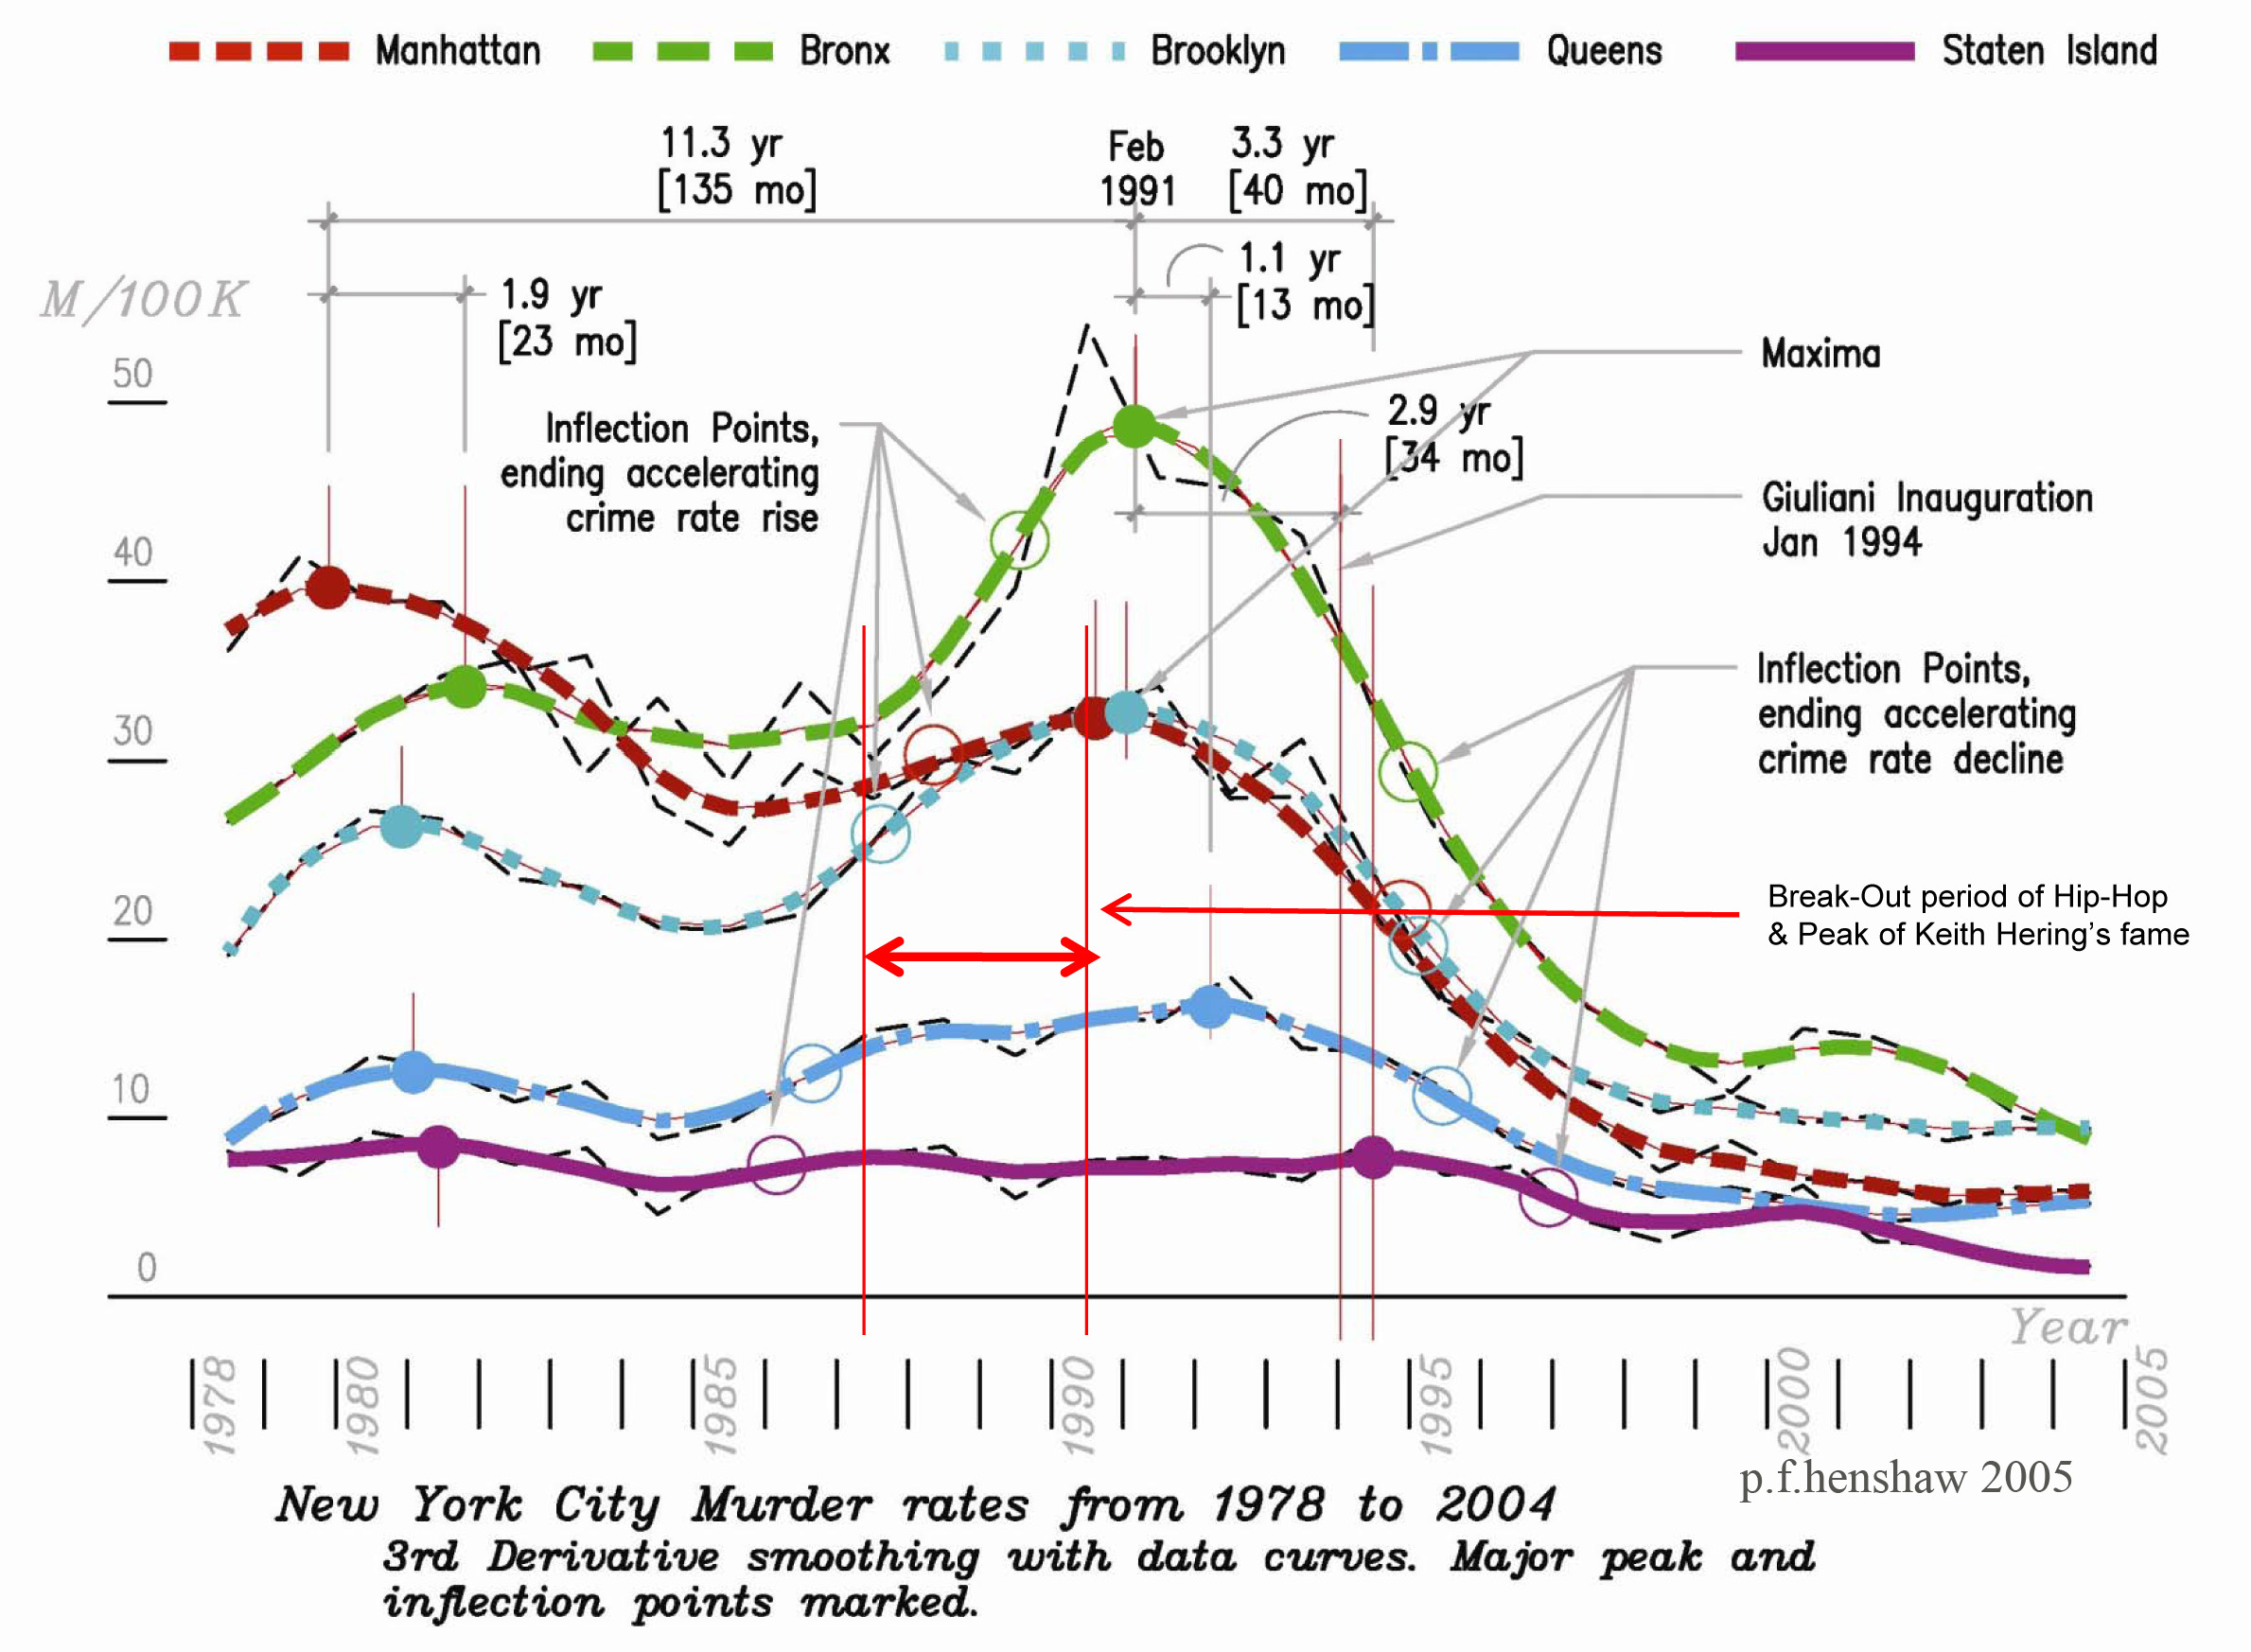
… three years before the mayor who took credit for it took office. The real main player was the strain on the families of the NYC drug cultures involved. They had become particularly traumatized by it, and the rest of society desperately searching for some way to change too. Everything people wanted to have work started working all at once, when their kids stopped looking up to the drug lords! They turned to the emerging Hip-Hop mass culture as an exciting alternative to be part of, a riveting story when well told.
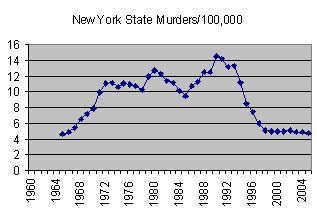
What tipped me off was the “decay curve” shape of the NYS murder rate data shown in the NY Times. The abrupt decay curve shape, rapid at first and decelerating over years, without wiggle, is a very clear indicator of the death of a natural culture, in this case seeming to be from the youth that had once fed it turning away..
2.
The US economy’s separate tracks for rich and poor
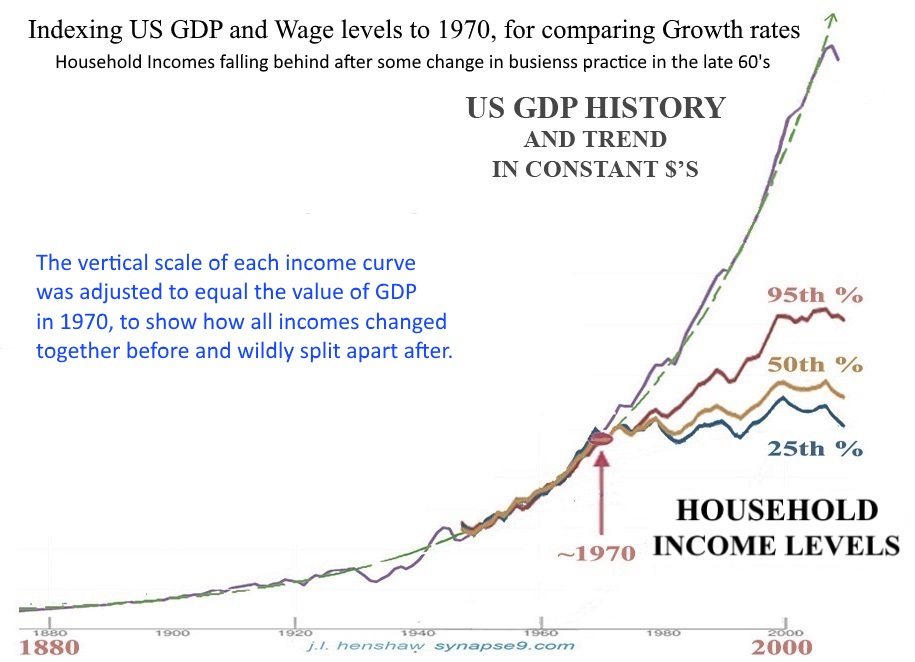
… a sudden structural change in how the US economy worked that broke out in 1968-70. A huge transformation occurred in how Wall Street defined profit, shifting from Wall Street seeing its role as helping businesses create value, to seeing its role as taking profit from business for shareholders. [note:…the strong appearance is that it actually changed the “polarity” of wealth management, in effect violating all of Asimov’s laws of robotics at once, as the first major use of computers for business to robotically take profits from business for shareholders (and traders)]. That shareholders and everyone else didn’t know maximizing the extraction of wealth from businesses would end up driving businesses to impoverish society… is of course the catch.
The curves here mainly indicate that something enormously big happened. The US data for median household incomes is “indexed” to US GDP (scaled to equal) at 1970, the time when the whole system behavior change occurred. GDP represents the whole economy’s income, that as the data also shows, before 1970, growing at the same proportional rates as the median incomes. It was after 1970 they all then split apart, with the GDP doubling and doubling while the median household incomes fell farther and farther behind.
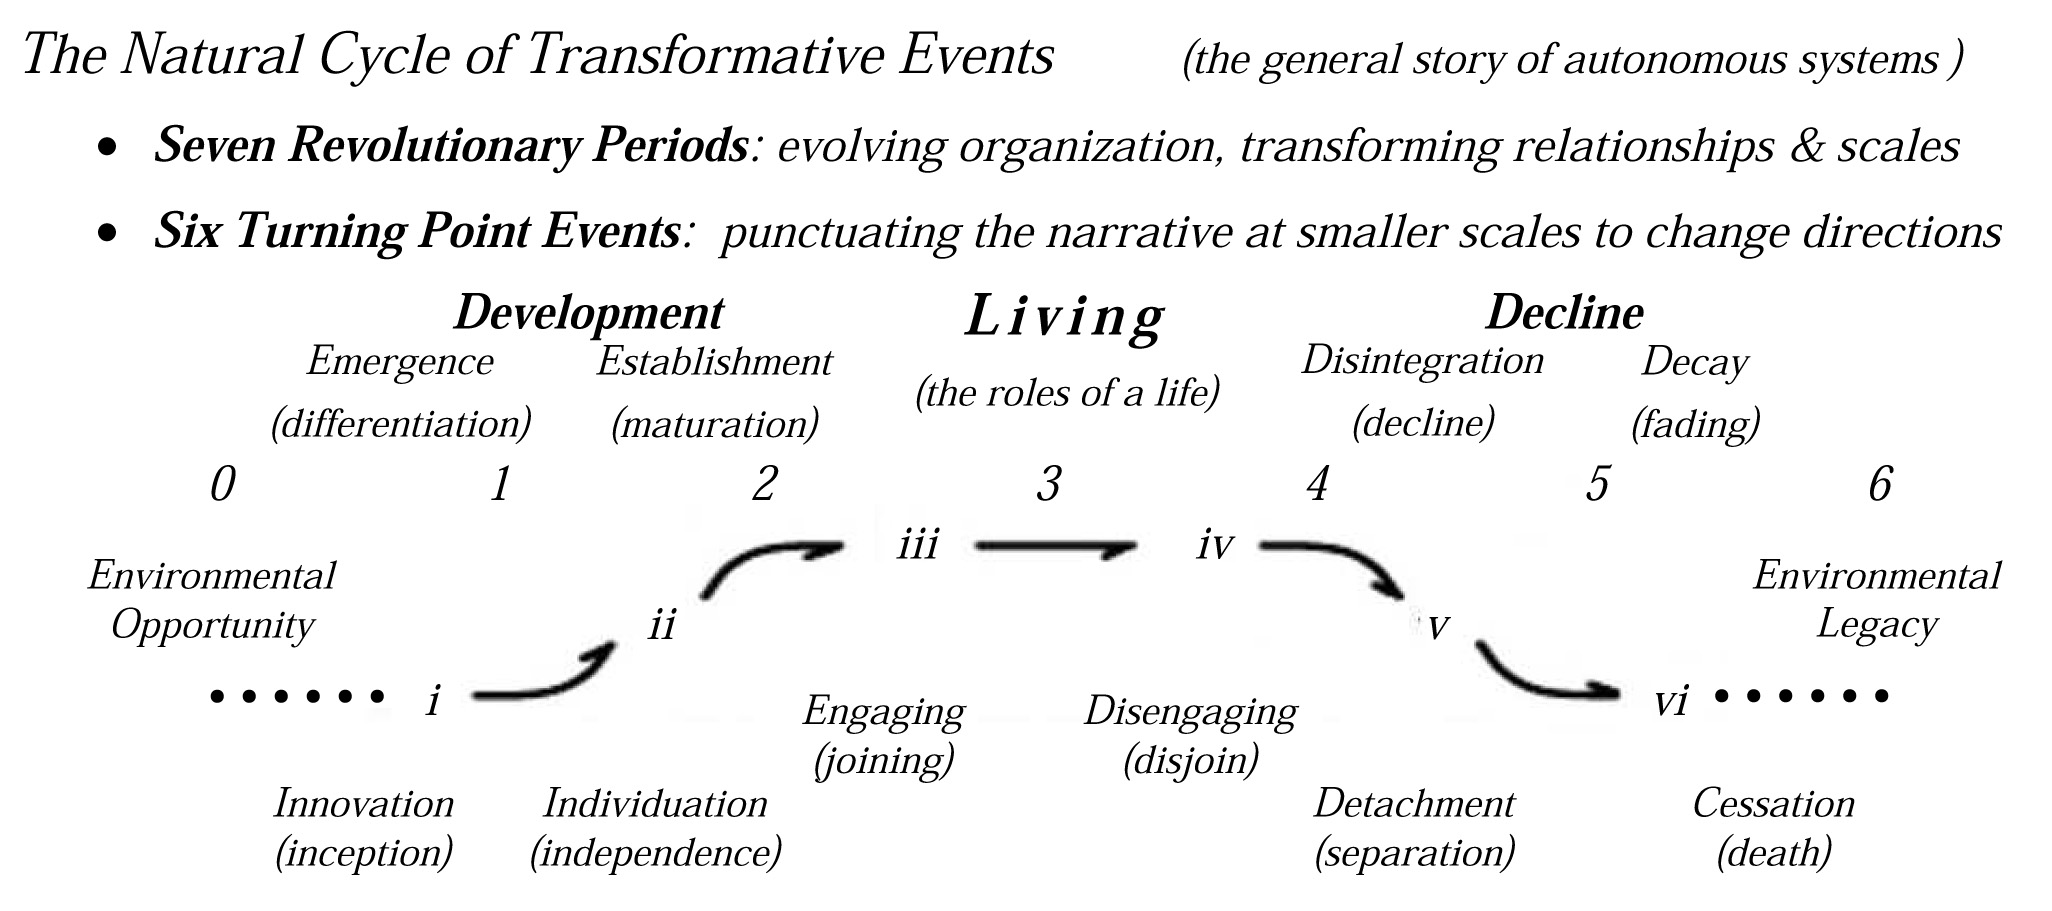
3. The “Life-cycle Markers” derived from the physics principle of “energy conservation”
…that implies it takes organizational development for energy use to begin or end. It helps make sense of the way regular proportional change (what growth and decay curves show) is so commonly present where lasting change occurs. Once you begin to ask “what happened” where lasting change takes place, you look for the evidence of organizational changes taking off. and changing directions.
jlh