Warm greetings, real math.
________________
We publicize the “special places” that are threatened, and people respond, yes. But we have to face that after 100 years of doing that, the environmental movement that our conservation groups and actions have been at the center of, has protected lots and lots of **special places** but is still not protecting the **ordinary places**.

The effect of our organizing has been as if we didn’t know the ordinary places were just as threatened as the special ones, by the same visible and ever expanding encroachment from our economy. Don’t we need to get that straight? Don’t we need to be much more direct in saying that the threats to the special places (that get everyone’s attention) also symbolize the threat to the earth as a whole?

If we do that it could materially change the common goal, recognition that really save the earth we need to **remove the threat**, not just **protect the things that symbolize the threat**. Isn’t that a change in view we need to bring about?
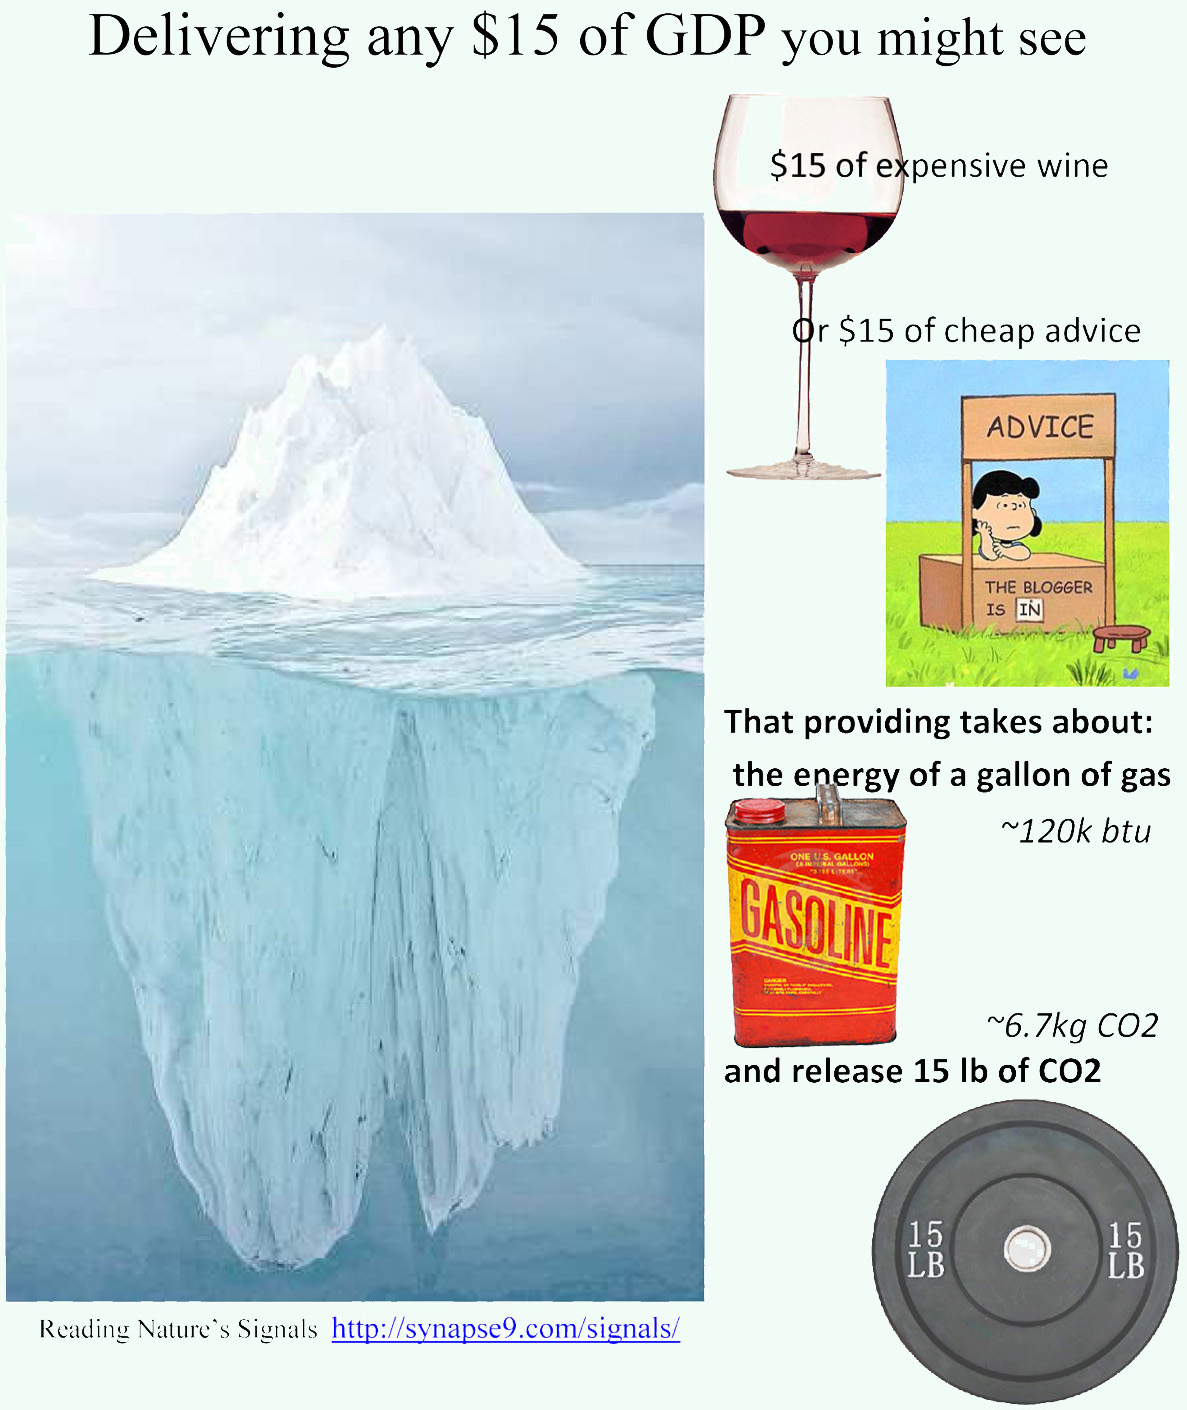
You can see the dramatic difference in how you’d then calculate your CO2 footprint… adding to what we normally count the CO2 produced in delivering *our normal goods and services* too, whether it’s spending on rent or dinner. The money we spend all ends up being very widely spread around to pay for doing millions of other things, and ends up as being responsible for close to an average share of all the services that generate GDP. The world average for $1 of goods or services is about 2.4 kWh of energy and .46 kgCO2, a much larger part of one’s global footprint than the direct energy consumption that any available footprint calculator is designed to report. To get the real picture we should combine them.

To combine your directly energy use footprint with your economic energy footprint and convert to total CO2 I generally just use 90% of the average economic footprint. That reduces the proxy measure to avoid double-counting. The 90% the amount that research suggests won’t be directly counted because it’s so widely distributed to be untraceable. Then you can combine the directly traced and distributed economic impacts, for the best estimate of the true total.
The result still has some uncertainty, but is much more accurate on the whole. The average rates also decline for improving world efficiency over time, but quite slowly. The above averages are for 2006. The world’s economic efficiency improvement hardly shows the big efficiency gains you hear advertised, being outweighed by all the things already working at maximum efficiency. The resulting average rates steadily decline, but only by ~ 1.3%/yr or a total of ~5.6% from 2006 to 2014. One’s uncertainty for other calculation errors may add another 10% or more. So I just use the 2006 figures as just approximations, only going to the trouble of update them for new research when really needed. The end the result doesn’t really change. It’s still that your total footprint probably goes up by 400% or more, since 90% of the energy consumption you directly cause by paying for is so widely distributed it doesn’t get counted.
If you convert to English units, the average economic energy impact of consumption is around 8000 btu and 1 lb CO2 per $1. What that means is illustrated by the impact of a $10 glass of wine. There’s the nice 6 oz fermented drink for you, add 10 lbs of warming CO2 for the earth. Since ALL your spending has a similar scale of impact… the question stops being what to spend on. It becomes how to “do more good” with the impacts of your spending, to have a growing counter-effect sufficient to change the global system producing the global warming, some “very new math”.
That seems to be the question that people need to ask to “go beyond consumption” in causing change, and make their plan to spend for impact on what matters to them the most.
_______________
ref’s
How full is a “Glass Half Hidden”?
Easy Intro, “scope 4″ use & interpretation
A World SDG – global accounting of responsibilities for economic impacts
