
The Growing Effort to Decouple GDP from Energy use and CO2,
is having no apparent effect,
raising serious questions about the nature of our plan.
The graph below (Figure 1) shows the 46-year record of world GDP PPP, Energy, and CO2, during which their growth rates have been in constant proportion to each other, called their “coupling.” The things to read are 1) the lack of accumulative departure from the steady trends, and 2) how closely the exponential trend lines (dotted) follow the data.
It shows that the long trend still holds despite both big efforts and bigger promises that accelerating growth using more efficient processes would separate the expanding economy from its impacts. Focusing so much on the “positive” completely disguised the big picture, though, that in 46 years there has been no accumulative effect at all. So there’s a lot to explain, yes, but the graphs below show persistent regular behaviors of the economy as a whole resilient system, a problem not yet faced at all.
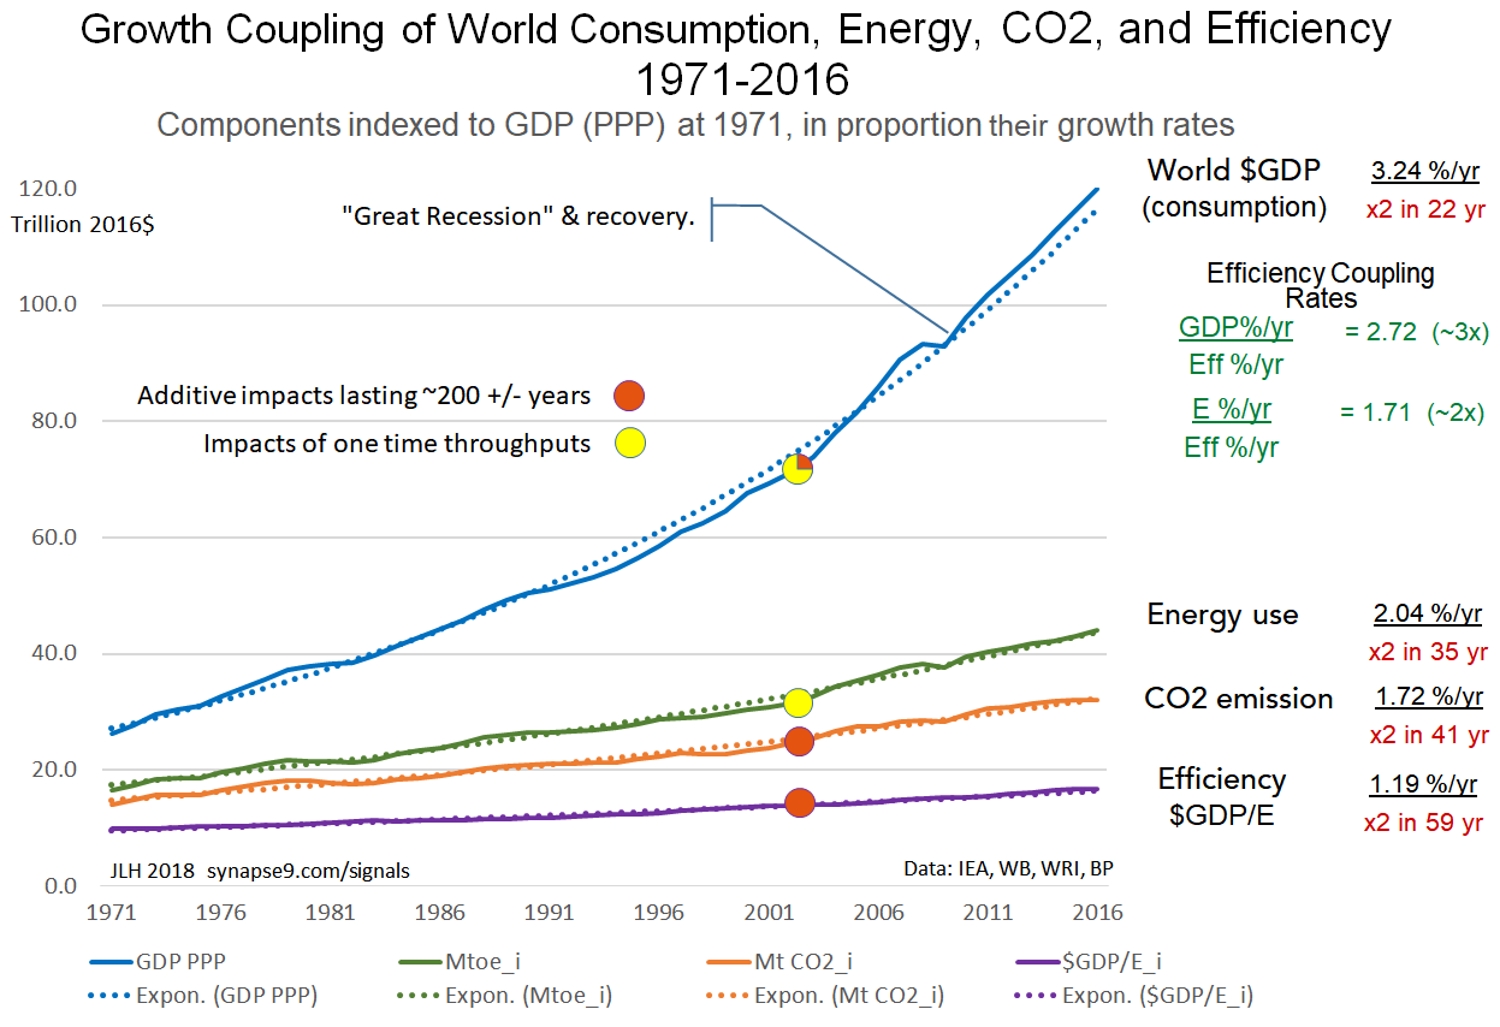
That energy use and CO2 emissions are now still growing at the same rate as 40 years ago is strong evidence that none of the sustainability measures such as exceptional efficiency gains said to decouple the economy from its impacts, have had any effect at all.
The irregularly fluctuating curves below (Figure 2) show the annual rates of coupling if world Energy and CO2 growth rates to World GDP (PPP). The scale at the left shows their locally averaged growth rates as a fraction of the locally averaged GDP growth rates (to somewhat smooth the curves) going below zero once. The important thing is to notice is that the fluctuations vary around nearly horizontal trendlines.
It’s as if the economy is guided by an “invisible hand” keeping the fluctuations symmetric to the near constant trend. It says the fluctuations have been adding up to no effect. The likely cause of this is how a competitive economy naturally works. Technology and resources are supposed to be treated as being fungible assets, to be constantly reallocated to maximize profits. In the data, that functional coupling between the physical and financial systems of the economy is shown working rather smoothly, replacing less with more profitable assets to maximize the growth of profits for the whole. That stable coupling of managed assets to growth is then an apparent natural emergent property of the system as a whole, as a partnership between human cultures and the financial world’s effort to maximize growing profits.
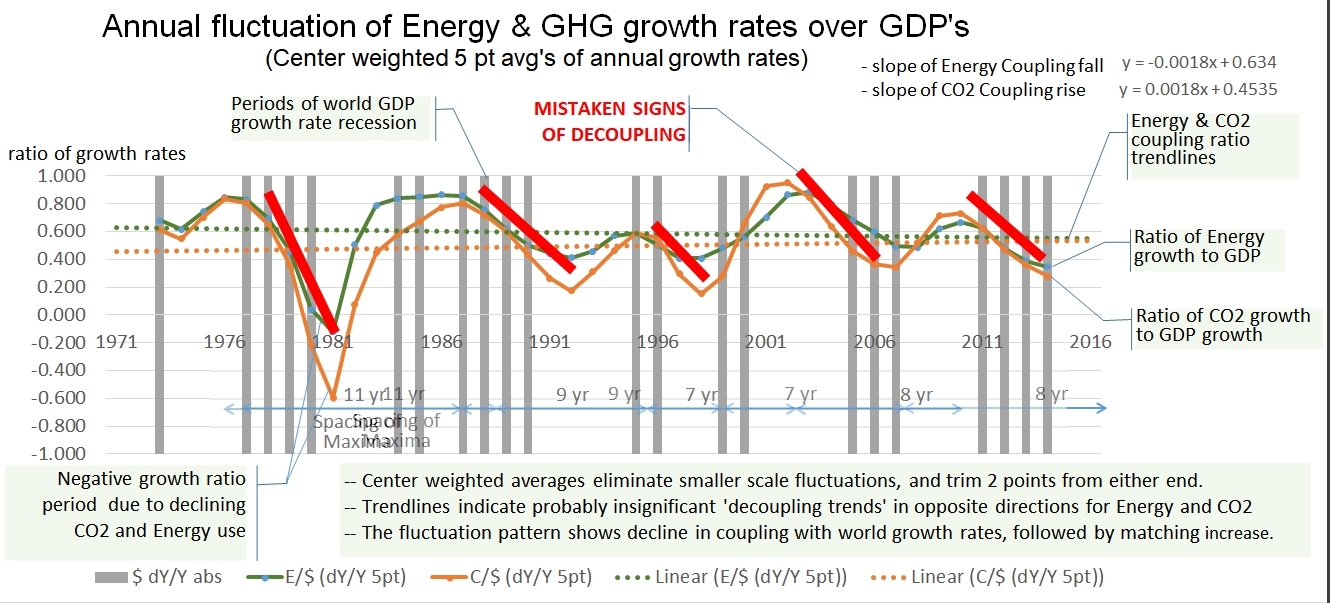
How the world community came to say that “sustainable development” would reverse this stable natural relationship between the economy and its resource uses is described in more detail in April 2014 in The Decoupling Puzzle. Small fluctuations do keep causing excitement for both devoted climate deniers and sustainability advocates, though, each picking out brief trends seeming to affirm their hopes, like the five periods of apparent rapid decline in CO2 to GDP coupling shown here. The real evidence is that the local fluctuations never seem to result in a change in the direction of the whole, like ripples on a pond that always level out. The latest dip in the CO2 coupling trend has been claimed as a sign of turning the corner by the IEA, clearly unaware of the consistent pattern of that metric repeatedly fluctuating around a near-zero trend.
Added perspective on the global data is gained by plotting the ratio of GDP to Economic Energy energy, the amount of wealth produced with a unit of energy. We call that variable “Economic Energy Efficiency,” the amount of economic wealth generated per unit of energy. Having its growth rate = 1/3 the GDP rate implying that improving efficiency contributes 1/3 of the value of energy to the world economy, growing Energy use contributing 2/3 if the value. That ratio demonstrates a general case of Jevons famous observation that in a growth economy efficiency results in growing rather than declining resource use and impacts. Any way one reasons it, what is crystal clear is that in the last 46 years strenuous effort to use efficiency for sustainability have had the opposite of the intended effect, recreating the original problem rather than solving it.

So we need to be suspicious of the world policy to maximize growth at any cost. The costs are rapidly swelling not shrinking. The other coupled impacts of growth also causing how people live being forced to change ever faster creating major disruptions and dissension all over the world is one of the biggest, though even the NGOs are very slow in recognizing. In nature, growth is how all kinds of natural systems begin, but those we admire for their perfection turn to refining their designs before they climax rather than, driving their growth to the point of being torn apart of being exhausted.
That’s the trick. Maximizing growth might seem logical as a way for societies to keep up with social distress and debts, but now it’s accelerating them. So now we need to balance the attraction of short-term profits and connect them all the unbalanced disruptive changes that now surround us. We talk lightly about replacing people with robots, for example, overlooking that the robots only work for the banks. That’ll make people and governments ever more indebted and incapable of responding to climate change, for one problem. And that chain of consequences goes on and on, that is as long as we keep ignoring how natural growth systems that avoid the problem work. More disruption is not the solution, only moderation.
There’s an alternative business model that could serve as a general design for growth without disruption, one that switches to paying the profits forward once any debts have been paid back. Once understood, that is what would achieve truly integrated, thriving and self-limiting development, as biomimicry of ecosystem designs. It is discussed in more detail in the article linked from my next post, Culture, Finance-for-Development, and tPPPs.
Use biomimicry for how nature uses growth to build thriving and enduring systems.
It would be a way for businesses large or small to begin to experiment with how nature succeeds in creating beautiful, thriving, and purposeful systems. It’s a fairly simple formula. It’s also a practice we all know well for how to successfully relate to other people and how to successfully complete business or home projects. It starts with building up innovations to then select what to refine for making the result resilient and purposeful in its environment. If we approached every new relation or project by piling on new experiments with no turn toward refining something to last in the end, all the effort would go to waste in the end.
To start you study the similarity between nature’s way of building things to perfection and how we do our own home or office projects! They all take place in “three acts.” The first act is for “innovating,“ the second for “refining,“ and the third act the “release” of the finished product into its waiting environment (IRR). You see the same three acts in the birth cycle, and in the start-up of new businesses too, as well as the formation of new cultures and most every other kind of individual development. The trick is really to pay attention to the inspiration that starts it off, as something to fulfill. That lets you anticipate and move smoothly between the stages of emerging development, first adding up more innovations, then refining the ones worth keeping to the end. It’s what comes most naturally when we can see the whole effect.
_________________
When you can see the whole it’s easy to recognize the point when adding more innovations begins to work against getting something finished, called a “point of diminishing marginal returns.” Of course on a home or office project what tells you it’s time to shift to finishing what you started is just sensing what can you finish while you have time and resources. For anything measurable, like wealth, the point of diminishing marginal returns is when it becomes more profitable to put efforts into getting things to market rather than try more experiments. To apply it to the world all you do is ask: “What is our real plan here?” and look around for how to perfect what we started, and at the right time stop taking on more and more that we probably won’t be able to finish. It’s a matter of shifting to pursuing achievable goals rather than hanging on to thinking ever bigger with no end in sight. Reaching for the right goal doesn’t necessarily make the work easy, of course, particularly for big personal, community or business projects. It just makes the work a lot better, and the end something fulfilling and rewarding.
I discuss that as a way to measure truly lasting success for the UN’s 2030 Agenda and its Sustainable Development Goals, instead of just “more, faster” the ways the UN’s goals are like the goals of business-as-usual, discussed in more detail in Culture, Finance-for-Development and PPPs.
JLH
Analysis Notes:
- The global GDP PPP curves show IEA data from 1971 to 2008 spliced to overlapping World Bank Data from 1990 to 2016. The curves for global Energy are from BP statistics, and the Global CO2 curves show data from WRI.
- The Energy and CO2 curves were each scaled to the GDP curves in proportion to their average growth rates for a graphically clear and honest comparison.
- dy/Y is the ratio of the change in a measure over the total, like an interest rate or growth rate measures. I get smoother curves by blending a bit, using a center-weighted 5 point bracket.
Data Sources:
- The world bank was my source for GDP PPP and for from 1990 to 2016
– https://data.worldbank.org/indicator/NY.GDP.MKTP.PP.CD?end=2016&start=1990 - World Meat Production – 1961-2016 Rosner – OurWorldInData: https://ourworldindata.org/meat-and-seafood-production-consumption
- World Food Production – 1961-2016 FAO: http://www.fao.org/faostat/en/#data/QI
- WRI has a very nice set of data on CO2 “Total GHG Emissions Including Land-Use Change and Forestry – 1990-2014” from the CAIT Climate Data Explorer – http://cait.wri.org/historical.
– Because the latest economic CO2 emissions data is 2014 not 2016 as for other data, the trend of atmospheric CO2 from CO2.earth was used to project the economic emissions data for the last two missing data points, showing no anomalous direction. https://www.co2.earth/annual-co2 - Atmospheric CO2 PPM 1501-2015
OurWorldInData.org:
https://ourworldindata.org/co2-and-other-greenhouse-gas-emissions
From Scripps source directly: (Scripps, 1958 to present)(Macfarling Meur 2006)
http://scrippsco2.ucsd.edu/data/atmospheric_co2/icecore_merged_products
Record based on ice core data before 1958, and yearly averages of direct observations from Mauna Loa and the South Pole after and including 1958.” - BP offered energy data in MtOe in its “Statistical Review of World Energy – all data 1965-2017”
– https://www.bp.com/en/global/corporate/energy-economics/statistical-review-of-world-energy/downloads.html - The IEA news item statement that CO2 flattened for 2016 and 2017 was used, just to show how little effect it would have if true
– https://www.iea.org/newsroom/energysnapshots/global-carbon-dioxide-emissions-1980-2016.html