
There’s been a long debate and mystery caused by economic accounting for the world’s energy use not being able to trace the trade in economic energy services, the amount of China’s energy embedded in our TV’s and the amount of of France’s energy embedded in Soviet block heavy industry… etc.
(See also “Pictures of WhatGDPMeasures” with 11 figures and brief explanations tracing the Money/Energy link)
A country’s Share of the World’s GDP per Share of World Energy, measures
“Relative Economic Energy Dependence” ‘NEED’
a strong indicator of how much of its economy is fed by off-shore, mostly ‘fossil’, energy services, most often not being counted in national energy accounts. Countries do have different energy productivities, but World competition actively selects competitive energy uses wherever they are found. So like waves on a pond… the national accounts vary in relation to each other, and the global accounts are smooth and reflect the gradual changes of the system as a whole.
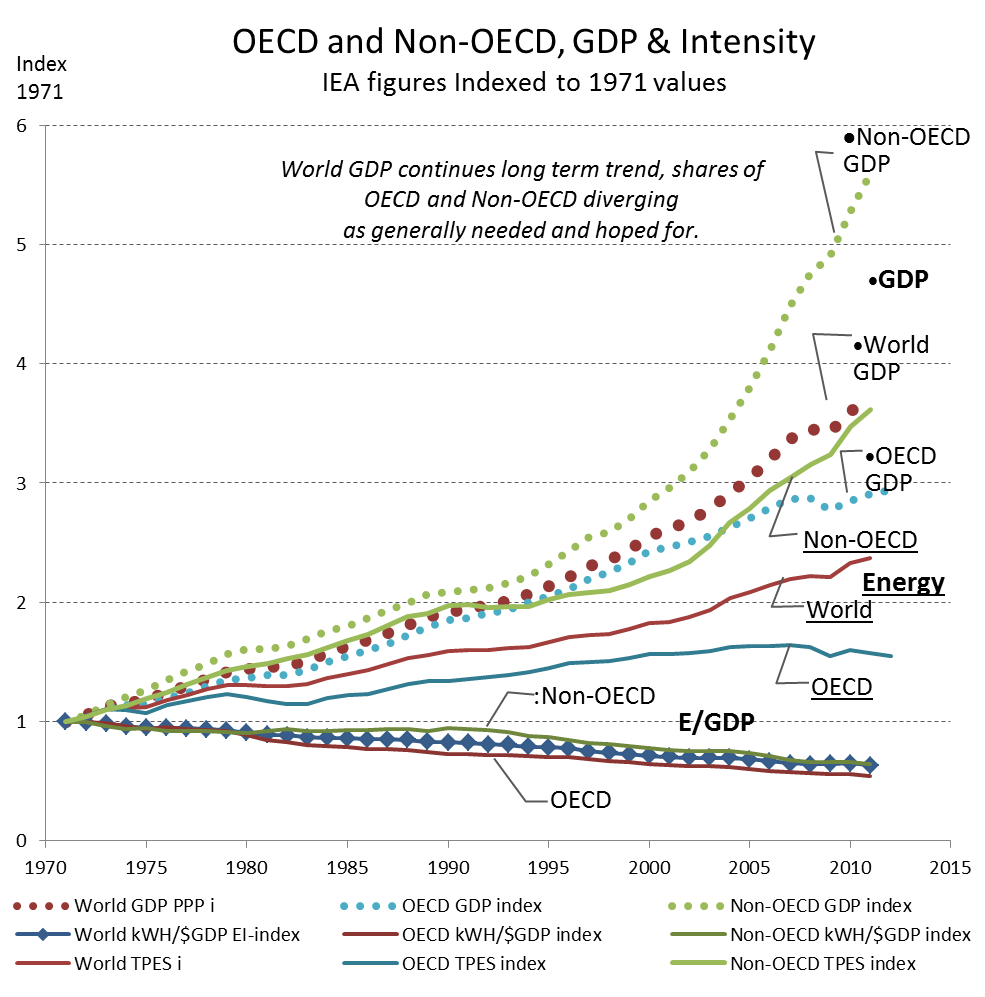
We see in Figure A strong diverging trends in GDP and Energy use for OECD and Non-OECD groups, along with converging steady trends for the ratio Energy/$GDP, over the past 40 years.
- As the less developed remain smaller, but grow faster, the more developed are giving them development space.
- The Energy/$GDP (intensity) is continuing it’s long historic path of quite steadily decline, NOT diverging, showing how smoothly the interlocked productivities of the world economy “level the playing field” for energy services, delivered to where they are most valued..
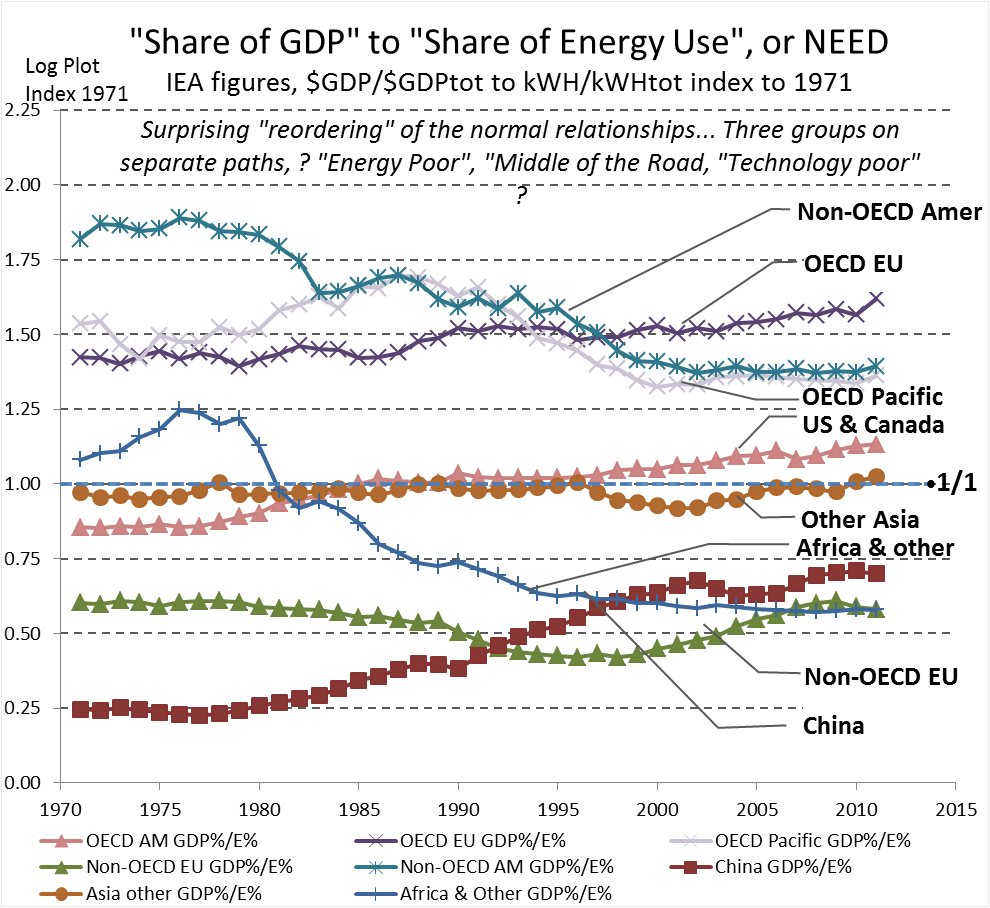
Figure B shows the NEED of the major 8 World Sectors shows much more variation, and you can see some of he fitting shapes that cause the total to be a straight line.
- The US & Canada are close to the 1/1 average, but steadily rising
- The EU, Japan and Australia are ~1.5/1 rather dependent on Off-Shore energy services, lacking abundant sources.
- So the ridh “Energy Poor” economies need to purchase more and more of their energy in the form of energy services from their neighbors, as “how economies work”.
- It causes a likely mistaken impression the EU is more “sustainable”, greatly outperforming the US & Canada.
- National Energy Accounts don’t trace trade in energy services, only trade in energy materials, needing a “Shares of GDP” proxy measure as here to find it.
The National Energy Accounts are not set up to trace trade in energy services, only in materials, requiring a “Shares of GDP” proxy measure to find it.
It shows a very good reason why we all need to learn, as in Scope-4 impact accounting for the World SDG, the use of GDP as a proxy measure of average economic energy use, and also why it works so well. The “global economy” and it’s highly competitive use of world information on the most profitable uses of energy. It makes energy use a universal “currency” naturally, as a useful measure of GDP for many purposes, and the use of GDP as a proxy for energy use and environmental “externalities” resulting from our obtaining and using energy to alter the earth for our purposes.
_______
JLH