Dynamic Evolution in plankton size....
The mechanism
is unclear, but there is a lot that can be said about the shape.
The study clearly shows that the change occurred by a dynamic process
that started and stopped. The data used is the profile area
of G. tumidia samples collected from ocean floor sediments (DSDP site 214)
by B. Malmgren in 1983.
JHenshaw 1999
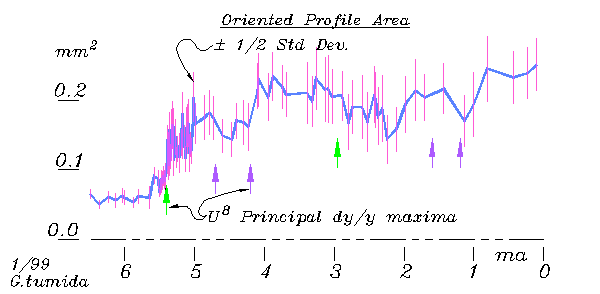 Some have speculated that this irregular shape represents
a random walk. The step variance test
determines whether successive variation is truly independent (as in
a random walk), or whether there is a tendency for successive variations
to cancel each other out, as in varying about a norm. The latter
is strongly indicated for this data, and the local variation ( noise) can
be suppressed by using a running average.
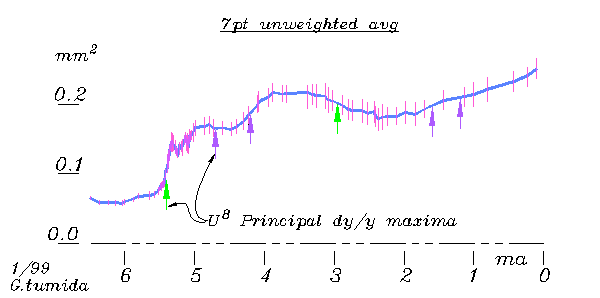 Here an unweighted
7 point average is used, showing the standard deviation bars reduced by
the square root of 7, approximating the reduced uncertainty of the
mean path. Some of the shapes in this curve are of statistical
nature, but most represent trends of change in the organism.
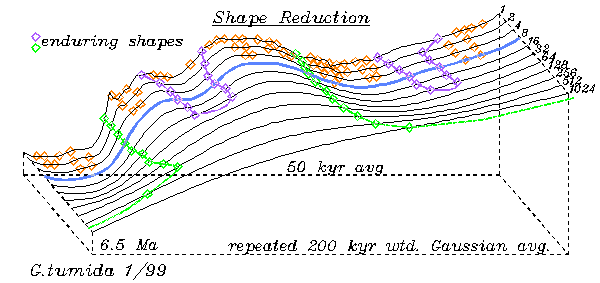 Repeated smoothing
eliminates the statistical shapes first as indicated by tracing the turning
points in the curve changed by repeated Gaussian weighted smoothing.
This flattens the shapes, but it also shows what shapes in the curve
are hard to erase. With some appropriate caution the
more robust features can be relied on to represent true features of the
underlying shape of change. This method originated with the Curvature
Scale Space method used for reliable computer recognition of objects (2),
but can also be used for identifying the robust shapes in time series data.
Here the shape smoothing was done with up to 1024 repetitions of a 200
kyr gaussian weighted running average.
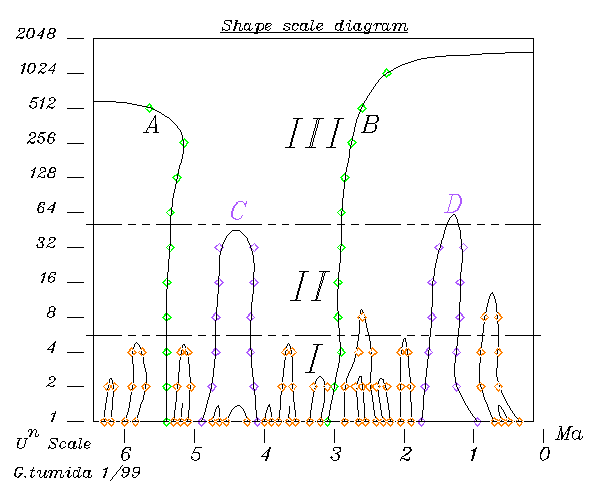 The
trace of the inflections points alone creates a shape scale space diagram.
In this case there are roughly three identifiable scales of shapes, distinguishing
what appear to be the remaining statistical fluctuations, minor
trend fluctuations and major trend reversals by their retention
at different levels. Identifying and matching robust shape
scales has been shown to be an effective method of shape identification
and matching in computer vision, and would be expected to provide an effective
means of firmly identifying relationships between, or disassociating,
natural historical processes. The diagram also shows that level
8 smoothing has eliminated virtually all the statistical shapes, and so
provides the least smoothed curve that will show only dynamics of underlying
process in its derivative.
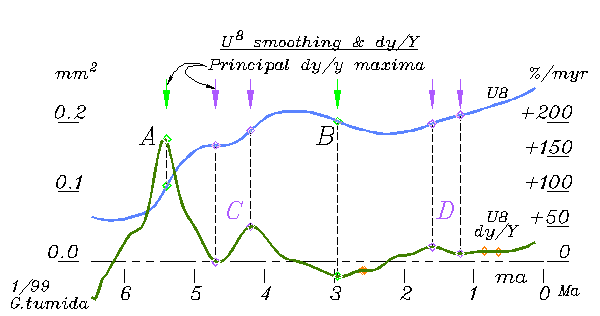 The
type of derivatrive used here is the log rate, dy/Y, rather than dy/t,
to show rate of change in proportion to size. Its strongest
feature is the sharp transient with duration and turning point coinciding
with the initial rise, the first 'S' curve. Whatever 'repercussions'
followed, this was clearly the main event. The shape suggests
the kind of creative natural system in which the mechanisms of change themselves
develop, take effect and vanish by self-organizing chains of effects.
P. Henshaw
id@synapse9.com
(1) Sequences sampled from a random walk will have increasing variance
the more widely spaced the points, allowing for distinguishing between
symmetric and accumulative noise with a step
variance test. sequences sampled from the Malmgren data
have nearly the same variance for more widely spaced points. For
a random walk, doubling the spacing of sampled points would double the
variance on average, and for 95% of random walks of this length the variance
will increase between about .75 and 1.25 times that rate. For the
Malmgren data the variance increases at only about .30.
(2) The simple idea is that the most consistent shapes will be the most
irreducible. The technical subject is multiscale imaging using curvature
scale space. A marvelous web page on the subject was put together by one
of the leaders in the field, Farzin Mokhtarian, demos
 Some have speculated that this irregular shape represents
a random walk. The step variance test
determines whether successive variation is truly independent (as in
a random walk), or whether there is a tendency for successive variations
to cancel each other out, as in varying about a norm. The latter
is strongly indicated for this data, and the local variation ( noise) can
be suppressed by using a running average.
 Here an unweighted
7 point average is used, showing the standard deviation bars reduced by
the square root of 7, approximating the reduced uncertainty of the
mean path. Some of the shapes in this curve are of statistical
nature, but most represent trends of change in the organism.
 Repeated smoothing
eliminates the statistical shapes first as indicated by tracing the turning
points in the curve changed by repeated Gaussian weighted smoothing.
This flattens the shapes, but it also shows what shapes in the curve
are hard to erase. With some appropriate caution the
more robust features can be relied on to represent true features of the
underlying shape of change. This method originated with the Curvature
Scale Space method used for reliable computer recognition of objects (2),
but can also be used for identifying the robust shapes in time series data.
Here the shape smoothing was done with up to 1024 repetitions of a 200
kyr gaussian weighted running average.
 The
trace of the inflections points alone creates a shape scale space diagram.
In this case there are roughly three identifiable scales of shapes, distinguishing
what appear to be the remaining statistical fluctuations, minor
trend fluctuations and major trend reversals by their retention
at different levels. Identifying and matching robust shape
scales has been shown to be an effective method of shape identification
and matching in computer vision, and would be expected to provide an effective
means of firmly identifying relationships between, or disassociating,
natural historical processes. The diagram also shows that level
8 smoothing has eliminated virtually all the statistical shapes, and so
provides the least smoothed curve that will show only dynamics of underlying
process in its derivative.
 The
type of derivatrive used here is the log rate, dy/Y, rather than dy/t,
to show rate of change in proportion to size. Its strongest
feature is the sharp transient with duration and turning point coinciding
with the initial rise, the first 'S' curve. Whatever 'repercussions'
followed, this was clearly the main event. The shape suggests
the kind of creative natural system in which the mechanisms of change themselves
develop, take effect and vanish by self-organizing chains of effects.