BATSE Gamma-Ray Burst, Trigger
551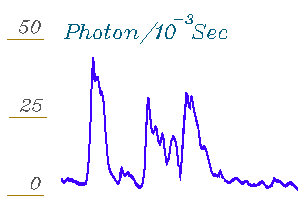
starting from....
 |
Raw
data
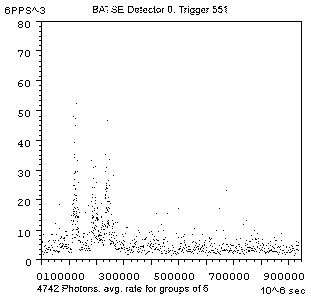
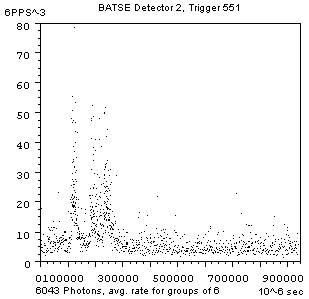
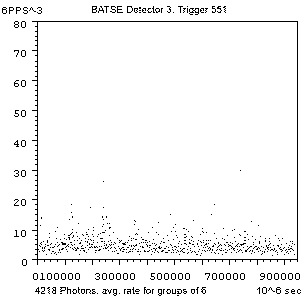
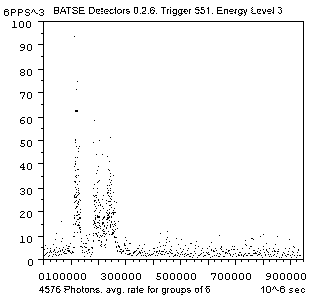
The data shown here consists of a 1 second recording
of all the photons recorded by the Burst And Transient Source Experiment
(the BATSE instrument) on the Compton Gamma-Ray Observatory (CGRO). The
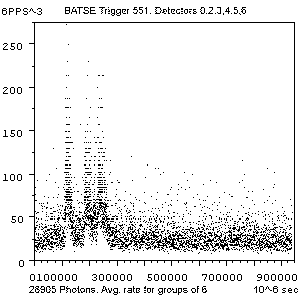
data was collected by six of the eight detectors and is called Trigger
551, showing three gamma ray burst events lasting about .03 seconds each,
a total of 28904 photons. Each point in the graph represents the average
rate based on every 6th photon. To reconstruct the process that produced
the event the points are linked consecutively and the shape of the curve
studied.
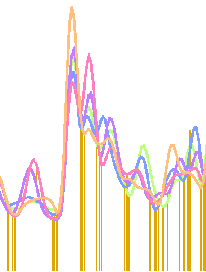
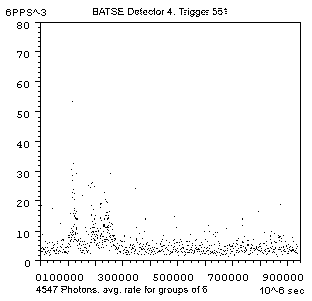
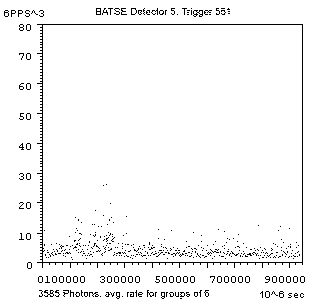
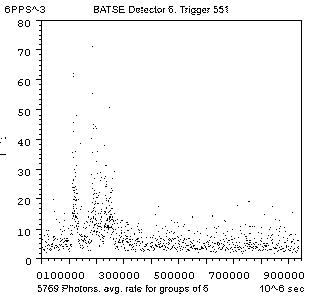
Some of the detectors appear to have been better oriented to the event
than others .Detector 0 , Detector
2, Detector 3, Detector
4, Detector 5, Detector
6. Detectors 3,4,5 show poor images of the event
so their data was excluded, and the data of detectors 0,2,6 were combined.
|
 |
Data Interpretation
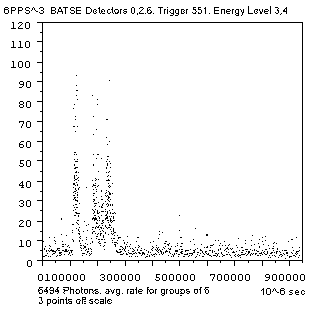
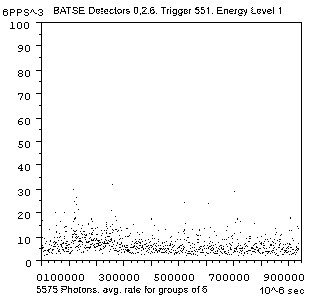
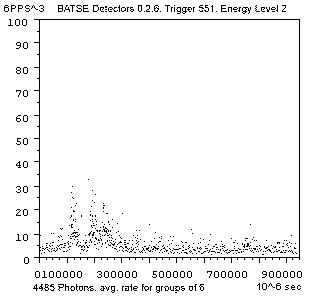
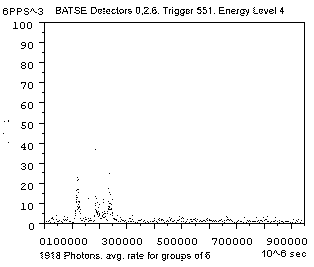
The rates of arrival of the photons of the four recorded
energy channels, 1,2,3 & 4 were examined. The photons of energy levels
1 & 2 show poor images of the event. Those of energy channels 3 &
4 strongly show the event. For detectors 0,2,6 Channel
1,
Channel 2,
Channel
3, Channel
4.
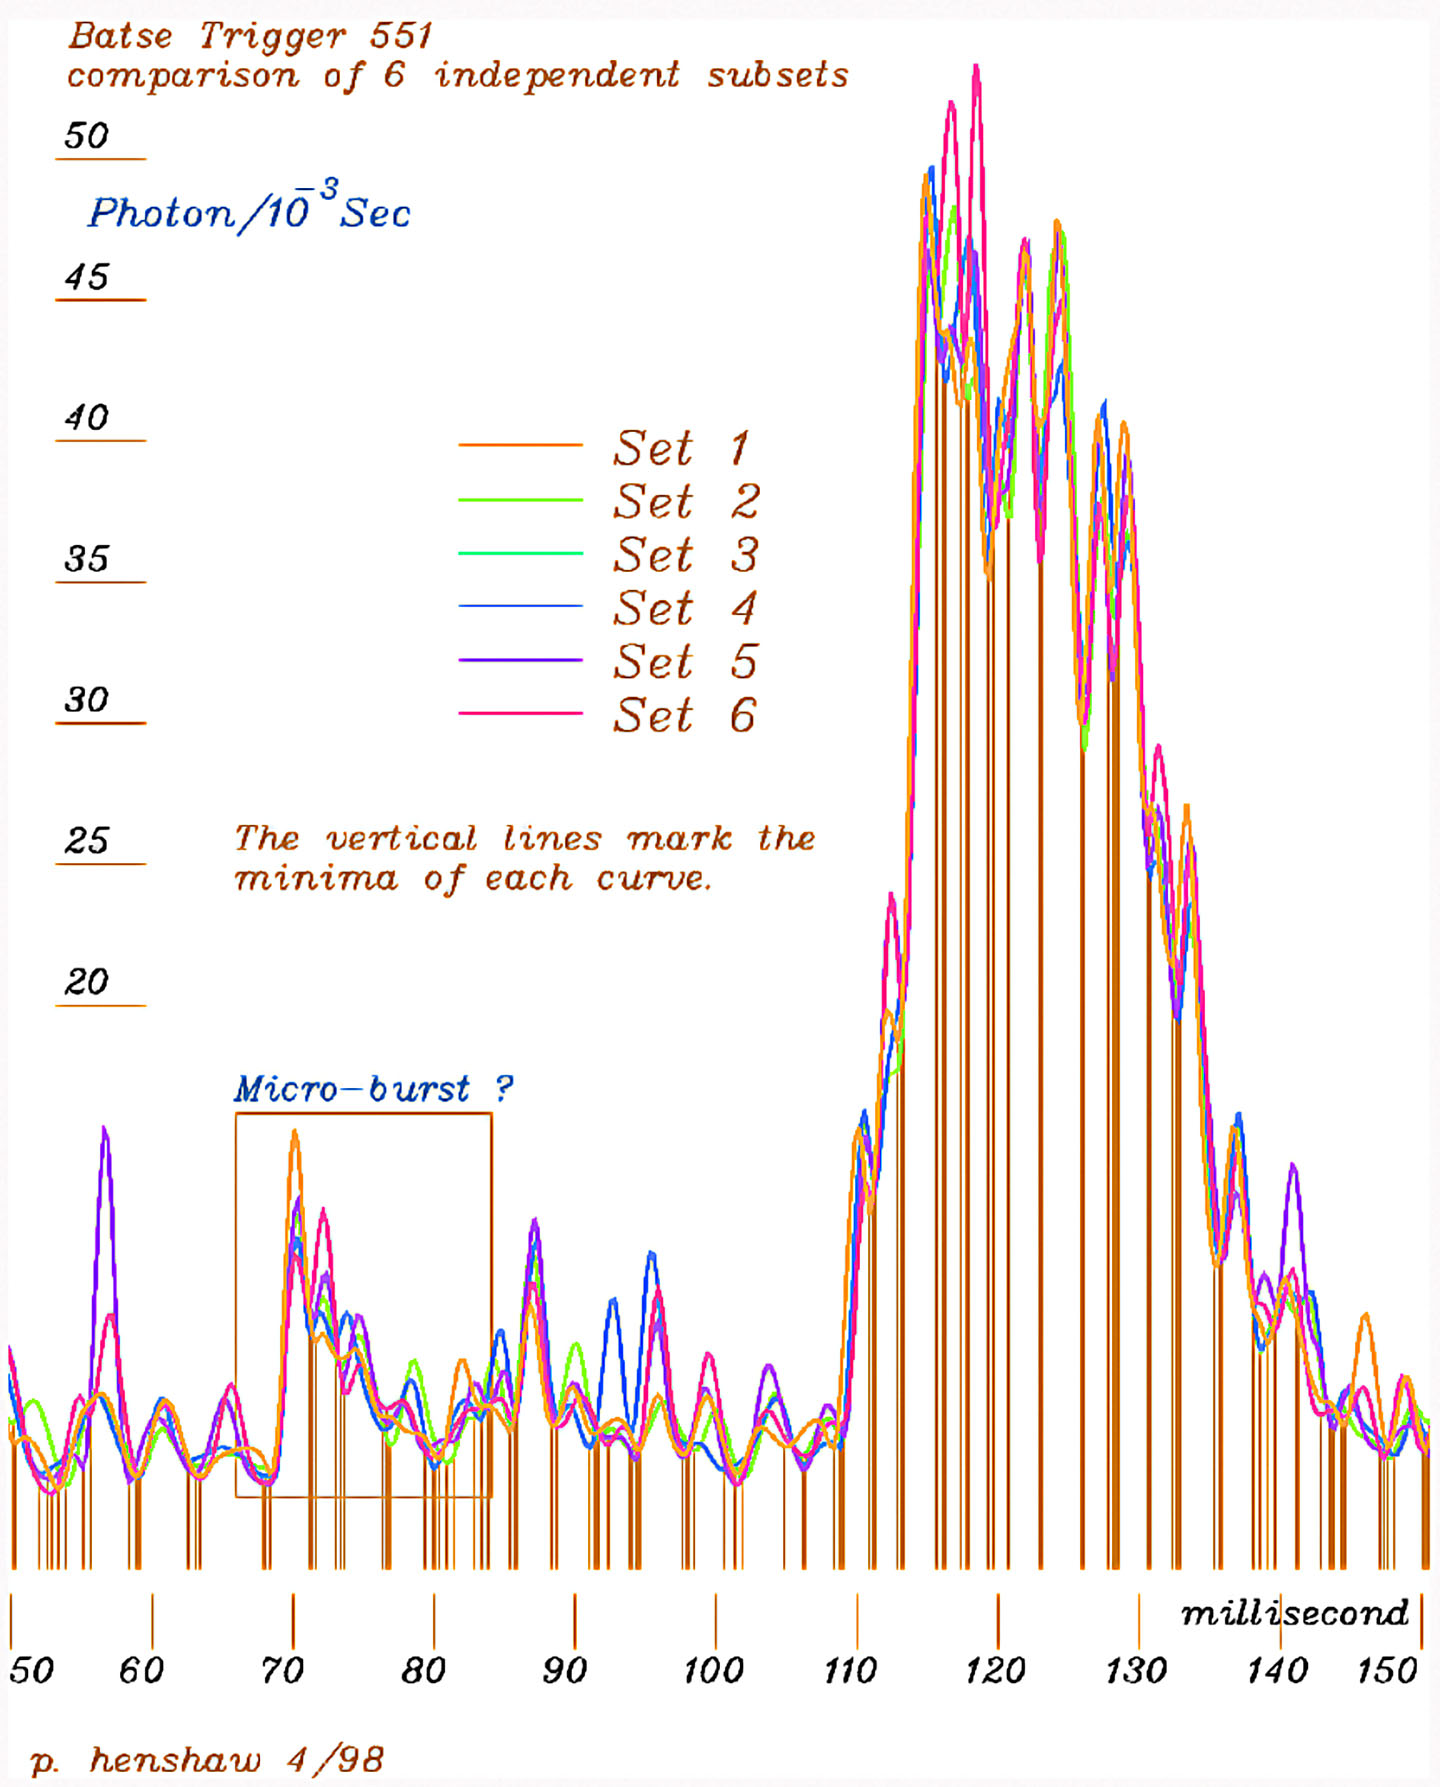
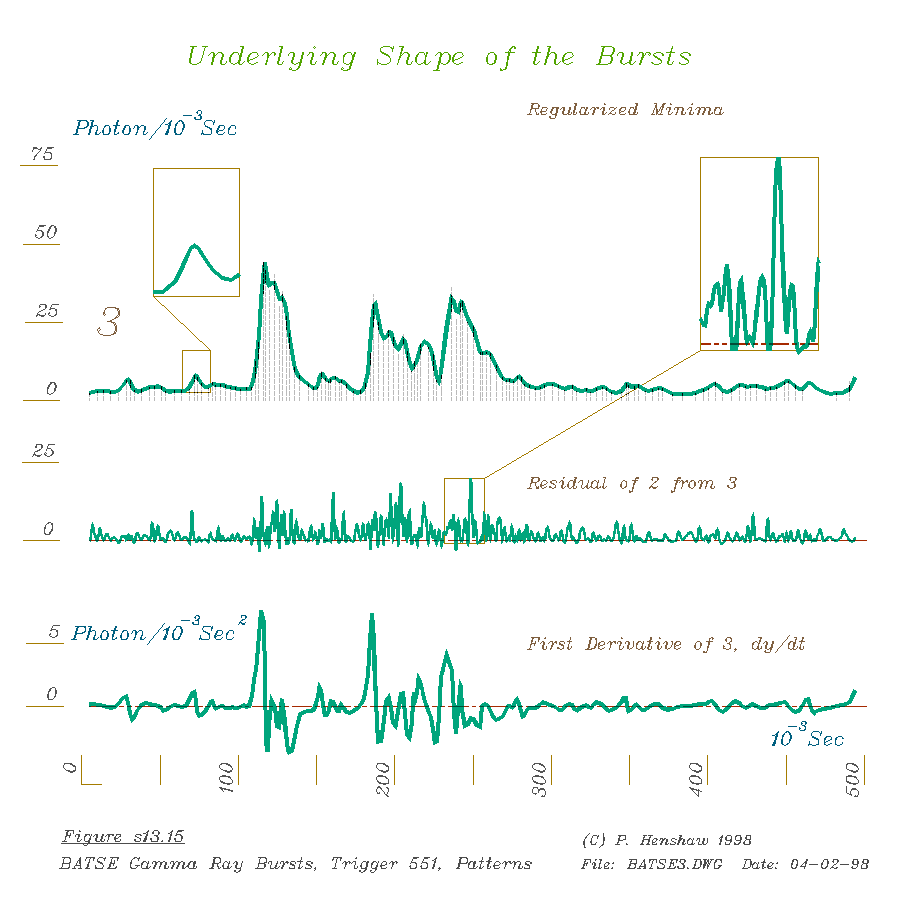
A half second portion of the filtered data (769 rates)
was then drawn as a graph (fig 1, curve 1) and the shape of smallest scale
regular patterns of fluctuation extracted (fig 1, curve 2). Then the larger
scale trends of change, (fig 2, curve 3) were developed. Figure
1. Fine Detail. Figure 2. Underlying Shape*DATA*
A look at the Classical Shape of a GRB
might help identify the underlying mechanism.
|
Curve 3 is a derivative reconstruction (DR)
of the shortest period of regular trends. It is a local smoothing of the
.0005
|
 |
second period averages (first dividing the ~1/2 second period into
986 equally spaced points) showing 139 fluctuations. The command history
reads: ...[1 outlier clipped from peaks 1 & 2 , GPAR 0.0005-Int, Ddsm-2x1,
Din2, Ddsm-2x2]... The .0005 second period averaging is command [GPAR-5
0.0005-Int]. The command Ddsm-2 (x1 is one iteration) replaces each point
with the point that would make the centered 4th derivative at each point
zero (see explanation of DR in other studies). The command Din2 inserts
a new point between each point by the same rule, giving the resulting curve
1972 points with very smooth derivative progressions that very accurately
fits the means of the original.
These steps don't alter the scale of the data but suppress
the jerk (3rd derivative) of the data as a curve over time, constructing an
organic "proportional walk", an implicitly
differentiable finite sequence by iteration, displaying the shape of
the dynamic continuities of the data and presumably also the underlying process.
The 3x magnification windows
in the figure show the detailed shape of the small scale fluctuations.
The shape shown in one of them (at 69.6 msec.) matches the shape of the
first large burst and seems to represent a small scale event of the same
kind, a micro-burst, though 'micro' hardly seems appropriate to describe
events of these enormous magnitudes. The derivative (fig 1, bottom) shows
the detailed pattern of its rates of change.
|
|
 |
Curve 4 is based on the minima of Curve 2 (as marked
by vertical lines). The minima, rather than the middle points of the fluctuations,
is used because the fluctuations in both the raw data and fine scale fluctuations
are one-sided. The further command history reads: ... [ Mlin-1 139-pts,
Din2, Ddsm-2x2]... Following the [Mlin] command that draws a curve with
139 points through the minima, derivative interpolation doubles the number
of points, placing the new points where the derivatives on either side
would approach each other, and further derivative smoothing produce a very
smooth dynamic curve with 278 points. The residual difference between 2
& 3 is shown (fig 2, middle), and the latter’s derivative (fig 2, bottom).
|
Since these curves based on the average rates of
photon detection using every sixth photon received in 500 milliseconds,
starting from the first, there are five other similar but independent data
sets that can be examined. A comparison of the results of using
all six subsets provides
a revealing display of both the consistency and limitations of this method of
analysis. One can see that the great majority of shapes in each curve have
corresponding concurrent shapes of similar scale in each of the others,
indicating a strong invariance due to statistical components in the data, and
conversely, an indication of the lack of statistical components.
A
simple statistical comparison and test of congruence is provided by the
numbers of minima found. The mean values for the full length of the six
subsets are 140.2 minima in 490.7 milliseconds for a rate of 3.53 milliseconds
each, with standard deviations of 1.47, 4.32 and .05 respectively.
Observations:
The first observation is that the frequency of fluctuation,
(visible in the vertical lines marking the minima in Curve 2, and repeated
for reference in Curve 3) shows considerable regularity overall, and general
similarity before during and after the major changes in photon recording
rates during the gamma-ray bursts. This does not appear to be simply a
rhythmic background source superimposed on the whole record. While the
frequency of small scale fluctuations is much the same, the amplitude during
the bursts (as also seen in the derivative) is much greater. One of the
possibilities is that the fairly regular fluctuation before, during and
after are from the same process that produces the bursts, continuing throughout
and varying in scale.
Two other possibilities are that all the fluctuations
are the result of a purely statistical source, or some fluctuating interference
in the stellar medium which distorts both signals in proportion to their
magnitudes. There is a slight increase in frequency during the bursts,
so perhaps the smaller scale background fluctuations are just buried in
the larger fluctuations during the burst process, which have similar rates
by coincidence. If the major fluctuations during the bursts do represent
variation in the generating process of the bursts then it would be apparent
that that process is highly complex, and not a matter of simple single
explosions.
The shapes of the small scale fluctuations in Curve
2 are quite symmetrical. On average each represents photon rate information
from 7 (=986/139) .0005 second averages, each representing 467 (=6494/139)
photons. These fluctuations would not tend to appear consistently symmetrical
if they actually were not. The more general shape of the burst events,
Curve 3, shows the general shape of each event as being quite asymmetrical,
showing rapid rise followed by irregular and slower decline.
Some aspects of the shape could be coincidental,
or the result of derivative smoothing, but the asymmetry is clear. For
further investigation, the initial shape of the first and second bursts
could be interpreted as exponentials, of approximately .008 second duration,
ending without stable climax. If this were reinforced, the combined characteristics
would be consistent with that of a process that develops from a center,
but grows so vigorously that it blows itself apart in many pieces, but
not so vigorous as to blow itself out entirely.
P. F. Henshaw 4/98
(needs edit jlh 03/17)
Derivative
Reconstruction


