There’s been a long debate and mystery caused by economic accounting for the world’s energy use not being able to trace the trade in economic energy services, the amount of China’s energy embedded in our TV’s and the amount of of France’s energy embedded in Soviet block heavy industry… etc.
A country’s Share of the World’s GDP per Share of World Energy, measures
“Relative Economic Energy Dependence” ‘NEED’
a strong indicator of how much of its economy is fed by off-shore, mostly ‘fossil’, energy services, most oftennot being counted in national energy accounts. Countries do have different energy productivities, but World competition actively selects competitive energy uses wherever they are found. So like waves on a pond… the national accounts vary in relation to each other, and the global accounts are smooth and reflect the gradual changes of the system as a whole.
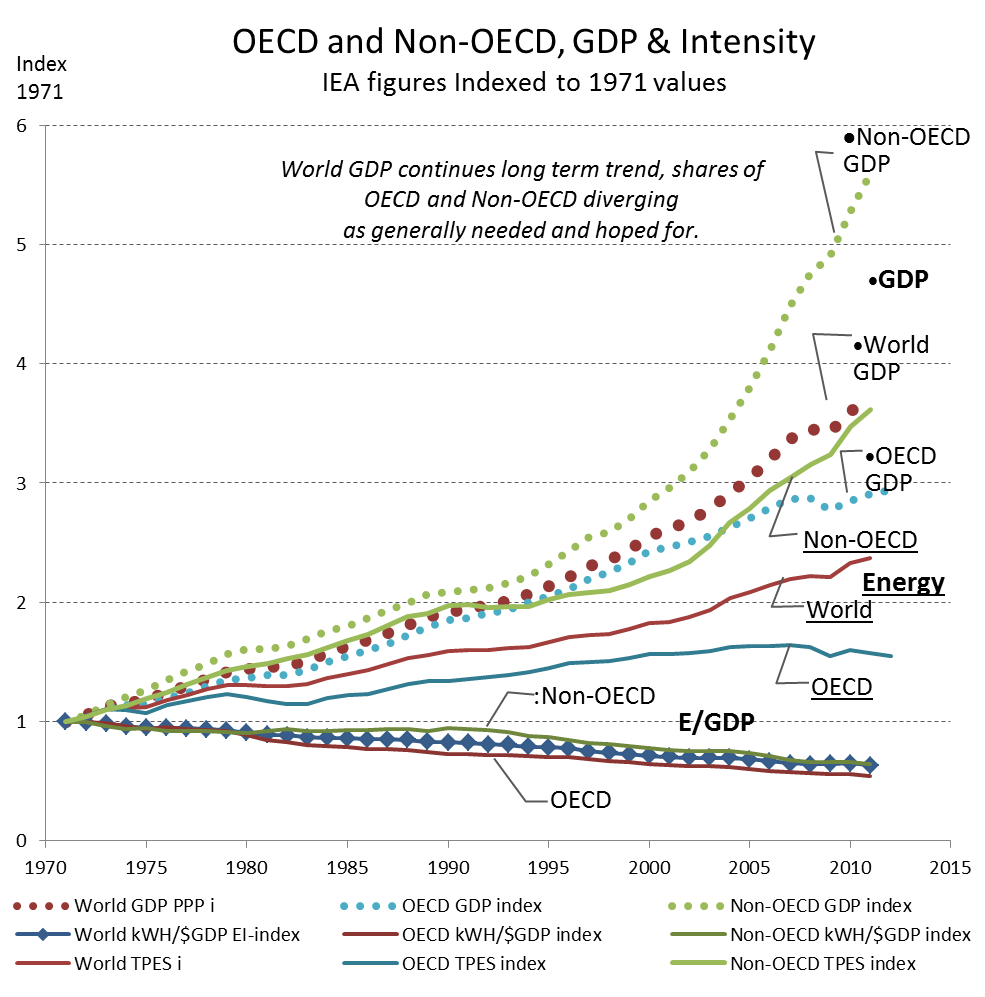
A. – World averages compared to OECD and Non-OECD performance
We see in Figure A strong diverging trends in GDP and Energy use for OECD and Non-OECD groups, along with converging steady trends for the ratio Energy/$GDP, over the past 40 years.
As the less developed remain smaller, but grow faster, the more developed are giving them development space.
The Energy/$GDP (intensity) is continuing it’s long historic path of quite steadily decline, NOT diverging, showing how smoothly the interlocked productivities of the world economy “level the playing field” for energy services, delivered to where they are most valued..
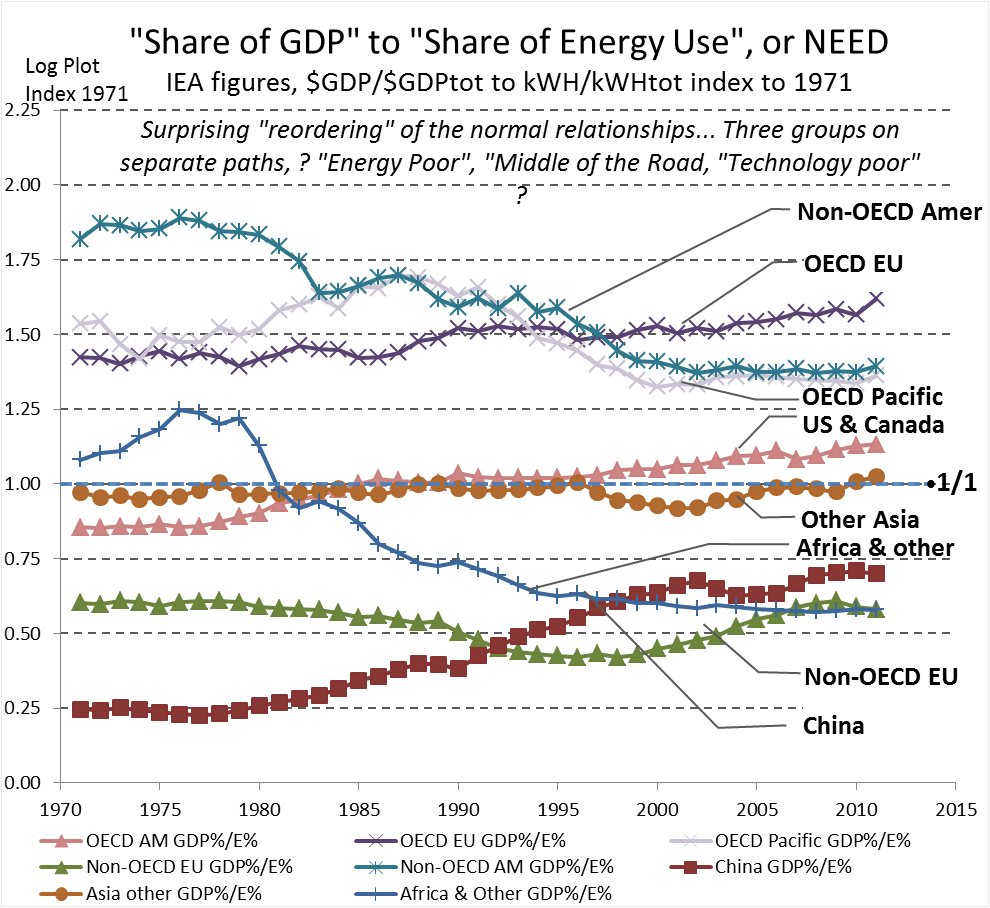
B. – The developed countries with less energy supply import energy services from others with more
Figure B shows the NEED of the major 8 World Sectors shows much more variation, and you can see some of he fitting shapes that cause the total to be a straight line.
The US & Canada are close to the 1/1 average, but steadily rising
The EU, Japan and Australia are ~1.5/1 rather dependent on Off-Shore energy services, lacking abundant sources.
So the ridh “Energy Poor” economies need to purchase more and more of their energy in the form of energy services from their neighbors, as “how economies work”.
It causes a likely mistaken impression the EU is more “sustainable”, greatly outperforming the US & Canada.
National Energy Accounts don’t trace trade in energy services, only trade in energy materials, needing a “Shares of GDP” proxy measure as here to find it.
The National Energy Accounts are not set up to trace trade in energy services, only in materials, requiring a “Shares of GDP” proxy measure to find it.
It shows a very good reason why we all need to learn, as in Scope-4 impact accounting for the World SDG, the use of GDP as a proxy measure of average economic energy use, and also why it works so well. The “global economy” and it’s highly competitive use of world information on the most profitable uses of energy. It makes energy use a universal “currency” naturally, as a useful measure of GDP for many purposes, and the use of GDP as a proxy for energy use and environmental “externalities” resulting from our obtaining and using energy to alter the earth for our purposes.
A wide and welcome discussion of our economy’s tendency to produce increasing “inequity” has followed the US publication of Thomas Piketty’s book, “Capital in the Twenty-First Century”, and offered me many chances to comment for general readers with interest in the deeper scientific questions. I think my best so far were my most recent two, for the special issue of the AAAS journal Science on “The Science of Inequality“. It’s really great to now have this chance to discuss the core dilemmas involved.
I hope not, but more or less expect, this opportunity to “come and go” without much consequence. That’s happened over and over, for a very long time. I’ve been watching it come up again and again for the past 40 years, and seen how each discussion fails to get to the heart of the issue, and have looked into the long history of “great debates” around it going far into the past. There are just clearly very deep conflicts between “how we think our money should work” and “how our world apparently works”, that are still with us. Science should be our tool for solving such problems, but hasn’t. So it seems we won’t get to the bottom of it until we find the right language to discuss it in. I think the language of natural systems is what will do the trick eventually, starting with “growth” being nature’s “start-up” plan and design for the invention and development of new types of systems, so the subject of what’s happening to our growth system is a good place to start. Let’s see! :-)
_______
Comments on Piketty’s inequality, “r > g”
For: – Science, the Financial Times, the Economist, New Yorker, Capital Institute, the Guardian, Salon, Piketty in ‘The Bully Pulpit”
>> Returns on investment seem to outpace the Growth of the economy <<
(.. so incomes from wealth and work .. d i v e r g e ..)
The true reason seems to be our long habit of maximizing growth ** measured as ** maximizing returns for re-investing …particularly now… when growth is pressing natural limits, and meeting natural resistance and complications that increase faster the harder we press them. What we need is to understand that turn of events. JLH
_________
Comments to the press:
I. on Inequality in the long run by Thomas Piketty & Emmanuel Saez; in the Special Issue on the Science of Inequality, Sciencemagazine – Comment5/28link
As with the “Occupy Movement” the diagnosis of the problem here is really wonderful. And for me it is VERY satisfying that someone finally found a way to raise an actually serious discussion on it. I’ve also been studying this phenomenon, as a natural systems scientist, for 30+ years though. So as much as I am really delighted to again hear the complaint being well expressed, as “Occupy” also did, I don’t yet see a move toward the level of understanding needed to point to feasible (win win) solutions for it.
One step in that direction would be a discussion of how investors change what they invest in. This is a “system” after all, and we need to look at how it works. Buy using the profits from a “good bet” to multiply good bets you change the odds, by physically changing the environment being bet on. That also naturally concentrates unequal wealth, in the hands of investors using that leverage to multiply investments.
Historically that seems at the very heart of all financial manias, like the kinds that develop before great panics and crashes. The rub is “multiplying sure bets” does almost nothing more certainly than “create bad bets”. That prefer to believe in the manias, though, instead of the obvious is part of the emotional struggle and problem. So… we have contradictions here. We’re still talking as the economists long have, of “ever faster accelerating increases in scale and complexity” as a “steady state”.
OK, in a theoretical world that’s OK. But here the discussion of “inequity” poses a problem of unfairness, regarding having “unequal shares” of what we now also see is “ever increasing instability”. That’s not ‘OK’. ;-)
Physics is certainly the right tool for this, but you need a technique of getting the universe to slow down tremendously, to let you see how the seeds of swelling inequities emerge and what they lead to. I did that on the way to developing a new physics theorem, that I hope will soon to be widely studied.
The theorem unifies the conservation laws to offer a general “law of continuity in change”. It doesn’t say theories can’t have discontinuities, only that uses of energy can’t, while pointing quite directly to nature’s marvelous “approximation to discontinuities”, her way of multiplying inequities on the way to precipitating dramatic changes in form in the organization in her complex systems.
Unifying the conservation laws shows its important to understand them as an infinite series of conservation laws, for all the derivative rates of change for energy use in physical processes. So as a whole it offers “a law of continuity”. http://www.synapse9.com/drafts/LawOfContinuity.pdf You can simplify the idea of it to saying “it takes a process to change a process”.
To see it happen you watch transitions intently enough to slow down the universe for your eyes, closely examining the steps nature takes to get things started, a fire, an eye blink, a plant, or any other “event”. What you find are little bursts of self-organization, following a non-linear trend most people would call “growth”, a process just full of things happening with a bang.
Growth is a distributed process of multiplying inequalities, is the relevance here. It’s a process of continually swelling inequities throughout a system, an explosion of increasing energy use, complex organization and change, that invariably triggers its own change in form. Where I first got the idea was by training my eyes to slow down the flowing changes of natural air currents, so I could watch “what made them so lively”, letting me discover how stable convection cells form from the instability of growing ones.http://www.synapse9.com/airwork_.htm
So, inequity is a natural byproduct of growth, essential to the systems growth builds, and as a process naturally leading to a change in form. In economics one common way for it to first cause growing inequity and then result in stability is by people realizing they’ve built as much as they can manage. Then they devote their resources to caring for what they built instead of continuing to build till that destabilizes it.
Is that possible for us?? I don’t know, but I think the physics implies we’re sure to find out.
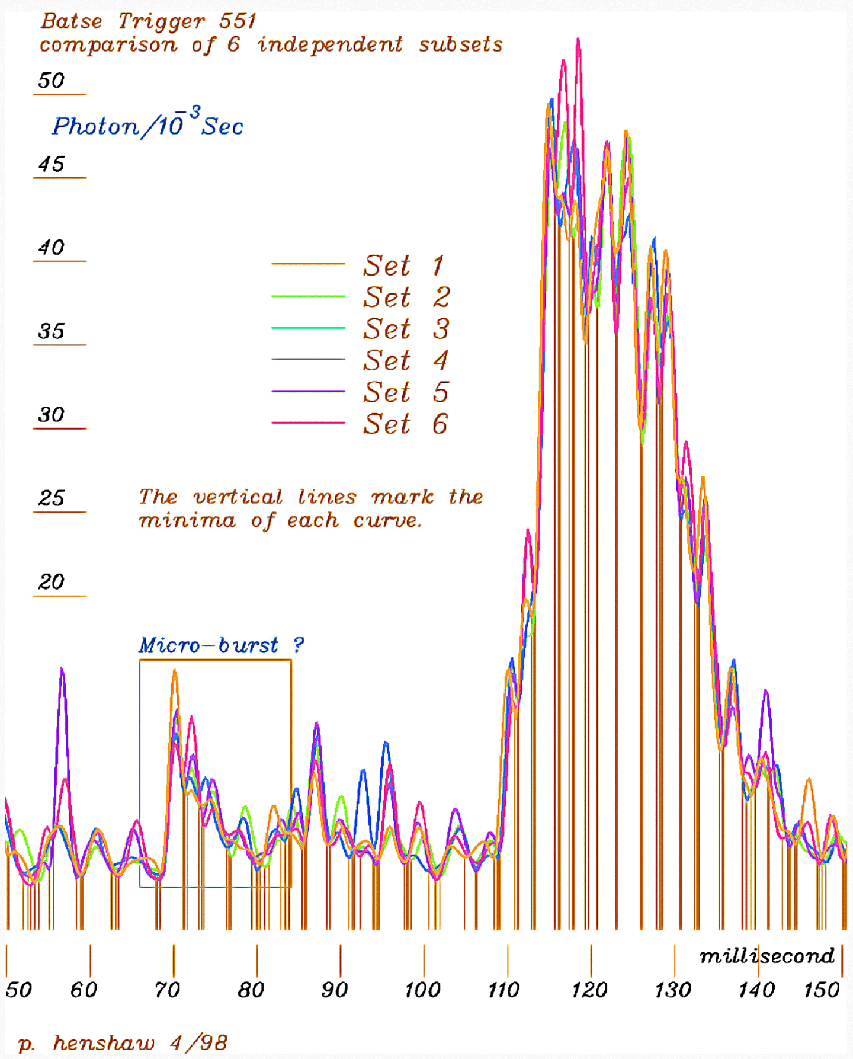
Gamma ray bursts are the most high energy events commonly observed in the universe, associated with the formation of “black holes”, and creating very high energy x-rays. NASA provides good introductory information with a nice animation. Satellite instruments easily record the time and intensity of these events but can only rarely connect them a location. So they’re one of the more mysterious of cosmic events, also common and occurring a few a week.
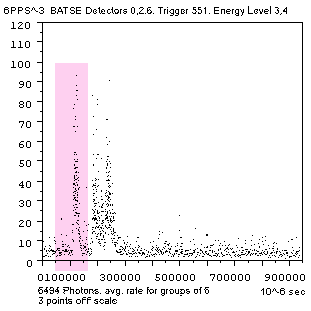
The 1998 gamma ray burst study was of the data from NASA you see in the figure below, called “BATSE Trigger #551”, using the 6494 points recording gamma rays in Energy Levels 3 & 4, chosen for being less noisy. The object is to reveal the detailed shape of any underlying continuous processes involved, as seen in the second figure. To date, it seems, gamma ray bursts like this are only understood as statistical events, like “bursts of noise”, instead of as dynamic events with continuous processes .
BATSE Gamma Ray Burst Trigger #551. Energy Levels 3 & 4
You can see below the clear dynamics of the first of the three major burst events in the record, consisting of a sudden rise without evident developmental processes, followed by an abrupt shift to declining by a regular “S” curve progression, of the decline first speeding up and then slowing down. That connection of two highly differing dynamics is something like the “bursting of a bubble”, with the breach of the containment and the release of the pressure having very differing dynamics. That analogy may not apply to black holes, of course, but understanding two different dynamics is likely important to understanding what is physically occurring.
Overlay of the Six Subsets of the data, with the 3rd derivatives regulated to expose the implied continuities the same way
The other highly noticeable shape exposed is an apparently fairly regular 3 millisecond fluctuation in the cosmic gamma ray background. As to whether is a feature of the data or of the analysis, one can see it is bothquite regular and irregular enough. The regularized curves are shown in six colors, each one representing the same derivative regularization applied to a different subset containing concurrent 1/6th’s of the whole data. The vertical lines mark minima for every fluctuation in each of the regularized subsets. Continue reading Gamma Ray Bursts – dynamics reconstructed→
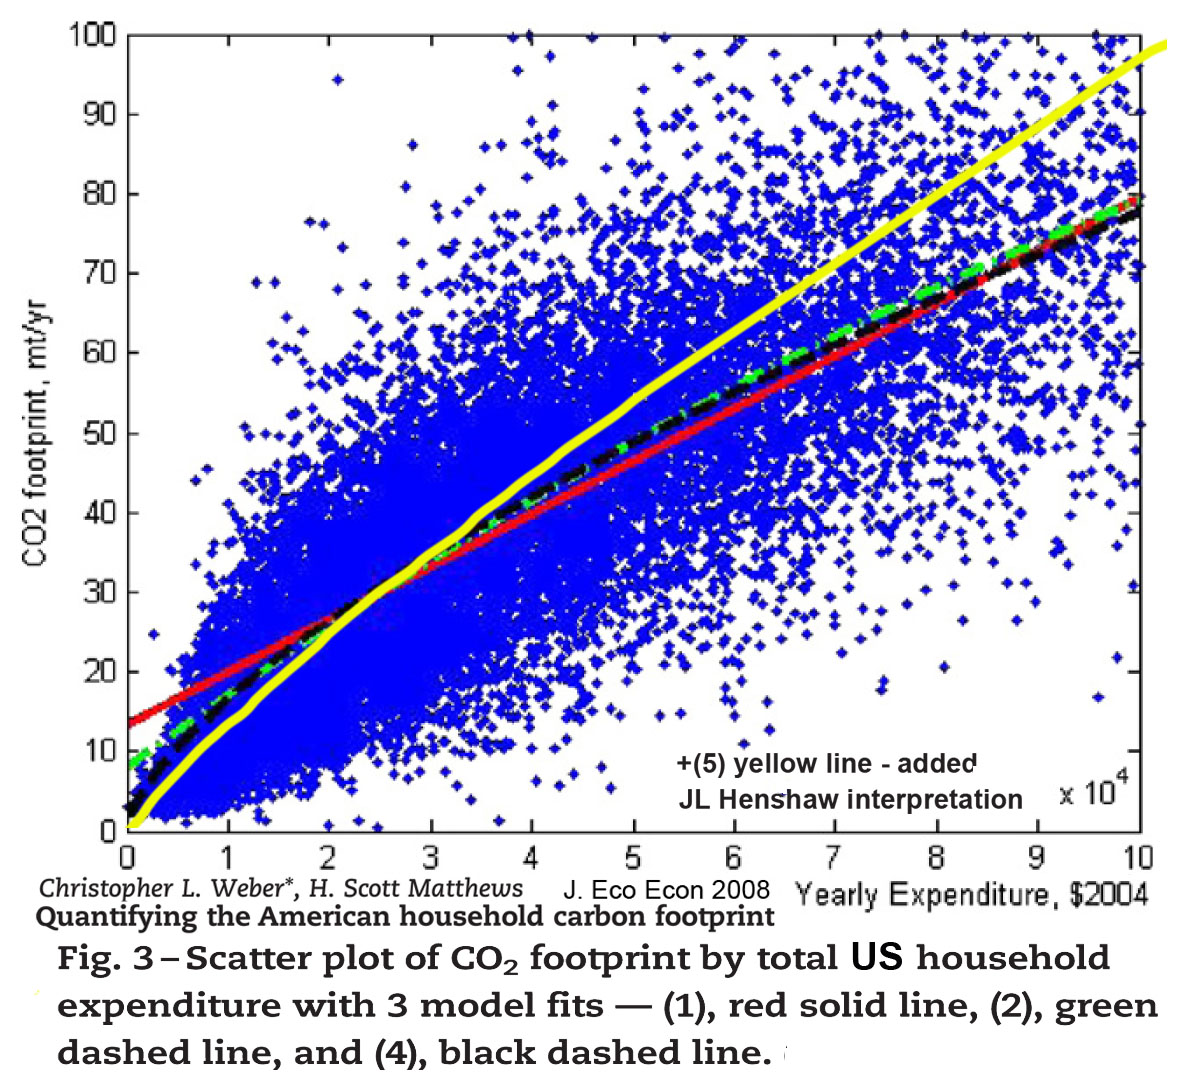
A “telling” image… connecting dots: the distribution of US household CO2 footprints, by income level from Weber and Mathews 2008
The average Co2 intensity is shown as ~1.0 kg CO2/$1 of income (the scales go to 100 tonne/yr CO2 and $100,000/yr income). That’s about twice the world average CO2 intensity, which was closer to = ~ 0.45 kg/$ GDP in 2004, (declining at 1.24%/yr historically). What it does nicely is confirm one of my most contentious conclusions from the Systems Energy Assessment (SEA) paper and so called “scope-4” assessment. It shows what it means to use average spending, like household “wages” as a baseline measure of average economic consumption impacts. Because the slope of the curve is so different from what I expected I think it remains to be confirmed. The US consumption intensity seems to be about double the world average. It doesn’t seem right but I don’t know what would cause that.
My interpretation of the trend is the yellow curve, just from the overall torpedo shape. A large poor population could be distorting the regression curves.
In any case, none of these household impacts being funded by businesses are being counted as impacts of operating businesses by the widely used sustainability metrics! That disclaimer of responsibility seems mostly to be for historical reasons, though, and for the simplicity of accounting for information coming from different places. It also shields business sustainability decisions from having to deal with quite the whole problem at first. Sustainability decisions will later be found to need to deal with it, of course, appearing now to start with a limited task, like a start-up problem, a bike with training wheels.
For the 2010 & 2011 SEA studies of a typical wind farm business plan, we tested what would happen if we were to include this discounted part of the business footprint as having a “world average” CO2/$ intensity. Our including it increased the total measure of energy and CO2 impacts for the business by 400%, as human services actually proved to dominate this seemingly technology centered business. With this new information on the US household impact distribution, I’d now need to say US businesses might actually have footprints 800% larger than presently being counted.
It seems we’re in the middle of quite some learning process! ;-)
This exploration of a pivotal world issue, on which the success or grand failure of our present global development strategy rests… is an example of the wide range of penetrating treatments of important topics covered in the Research Journal “Reading Nature’s Signals“. It document’s Jessie Henshaw’s current application of the the natural systems identification and organizational exploration methods that originated with a discovery in the 1970’s of how transitions in the continuity of natural processes expose the design of the systems and how they are changing, introduced in: The Physics of Continuity = ladders of change
We have a responsibility to use both the words of science and also the methods, when choosing methods of “Sustainable Development” to rely on for our effort to save the earth. It’s often not easy to do. Ask any scientist. It’s often as hard as sitting down to write a great poem, a different kind of creativity but just as demanding. This article discusses the correct scientific method for defining measures of “decoupling” our growing economy from its growing impacts on the earth.
That’s the part of the “Decoupling Puzzle” I can actually answer, offering a way to scientifically define an SDG for Post 2015 “economic decoupling”, and the measure of compliance. See also to the PDF file and XLS file to see the details of the model. It’s a bit different from the approach shown in the UNEP report on decoupling . What I define is an evidence based scientific measure of a growth economy departing form its reliance on growing resource use. It could be used in regulating the economy’s approach of our best understanding of the natural limits of sustainable development:
“A world Decoupling Rate that would assure, within planetary boundaries, adequate development space and “carrying capacity” to fulfill the intent of the SDG’s.”
How to transform the economy to create growing wealth without growing resource use is left to the reader or other discussions, though I give a hint to what that “entirely new kind of wealth” might be at the end.
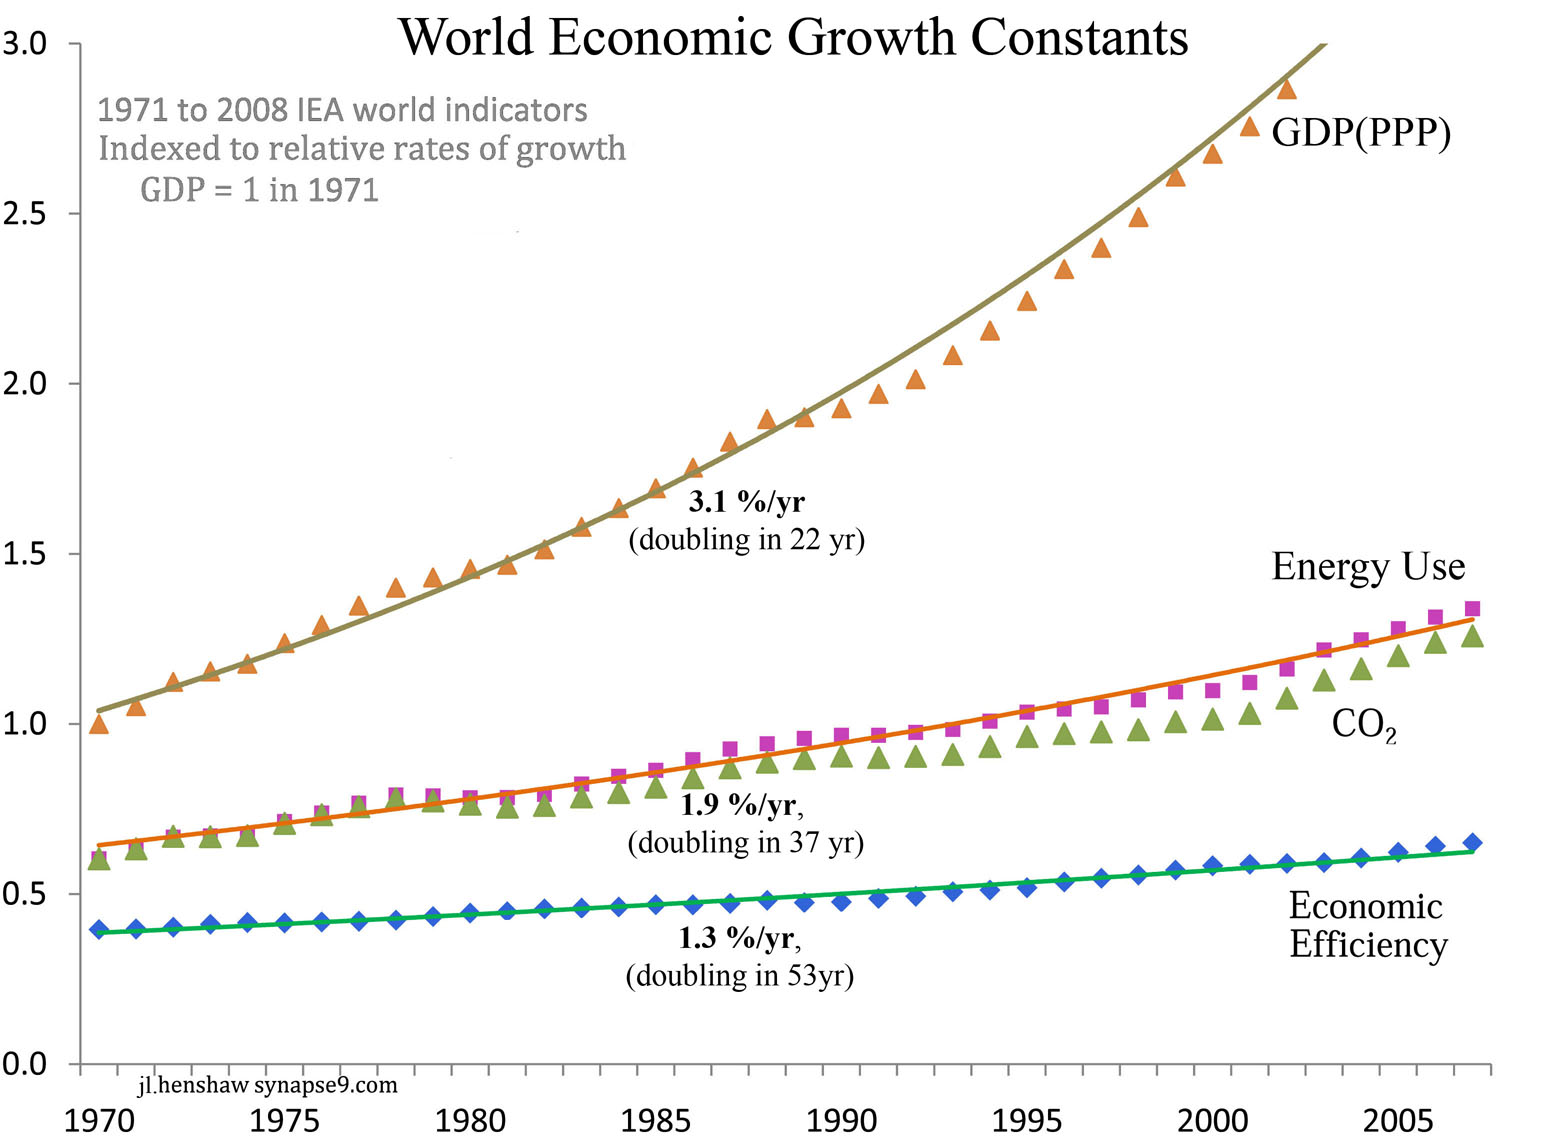
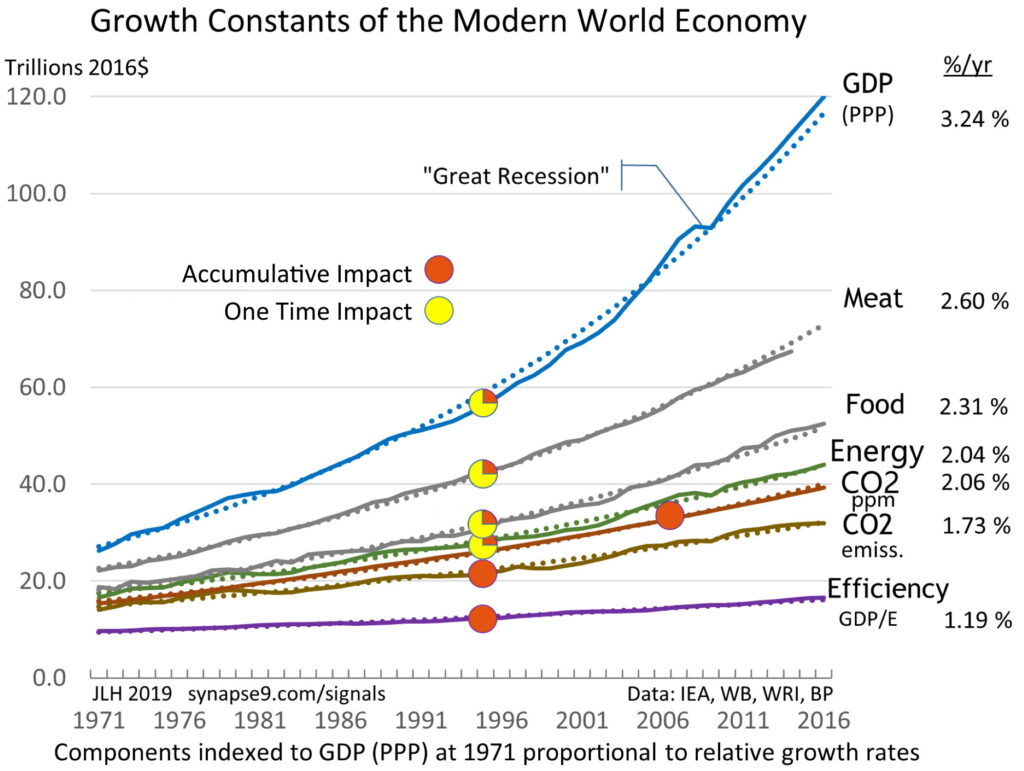
We start with the historic records that display the past “growth constants“ of the world economy. Figure 1. shows GDP, Energy use, CO2 and the GDP energy efficiency of the economy all growing together, with growth rates that are in constant relation to one another. That is the “coupling” of GDP and resource use that needs to be “decoupled”.
That evident constant growth rates and their proportionality (i.e. the “coupling”) is called “natural” because throughout history people have noticed it, tried to explain it, and also tried to change it, all to no avail. This coupling of these measures of the whole economy has continued as if measures of a growing person’s “height and weight”, growing at different rates, but still growing together. It has seemed to be just how the economy works.
As a systems ecologist, myself, I see them as displaying humanity’s natural rate of whole system learning, limited by coordinating all parts of human innovation and development efforts, while struggling to expand at the fastest accelerating rate possible. Systems ecology, then, does not consider economic growth as a “monetary progression” but as an “organizational progression”, a process of “whole society” building on its past to create a new future. This historical record is “how we’ve been doing it” so far, and now that we’ve found it unsustainable we need to change to something different.
…”growth” is a process of our learning how to coordinate doing what we want.
Fig 1. The historical coupling of GDP growth, in constant relation to Energy, CO2 and Energy Efficiency Growth
To measure a departure from that we start with the “Economic Growth Constants”:
GDP (3.13 %/yr), Energy use (1.89 %/yr), and Energy Efficiency (1.24 %/yr) . The linkage between the GDP and Energy curves, is the “EnergyCoupling Rate” (60.4 %/yr the ratio 1.89/3.13), how fast energy use grows relative to wealth.
The idea and fallacy of “Decoupling”
is to weaken that linkage between earth and economy to zero, changing what has long been a constant coupling rate of 60% by successive reductions to 0.0%, just by continuing to dramatically improve the efficiency of resources use as before. Many people believe new technologies should revolutionize development to do that, other’s think innovation will create products people prefer that just don’t consume energy to produce or to use. What both would agree is that 60% needs to decline toward 0.0%
We could define that transition as a “Decoupling Rate”, the rate at which the Coupling Constant of the past declines toward ‘0.0’. That would allow continued growth in wealth without adding to what we now see are globally unsustainable scales of energy use impacts on the earth. Defined for energy use alone would serve to define it not just for the impacts of fuel extraction and consumption, but also ALL the impacts of a material kind we cause by using the energy we extract for creating economic products.
So.. that would be generally inclusive of all economic impacts
that needed energy to be produced.
Scope-4 impact measures add up the total environmental inputs resulting from business, personal, or policy choices. That’s so we can compare different choices, and make the better one. Sounds like what sustainability metrics should do!
Standard sustainability metrics, however, collect impact information by where they occur,
not by what choices cause them…
So our whole metric system needs to be rethought. Today if a business decision involves employing six new machines and six new people, all that is counted are the impacts of the machines. The impacts of hiring the people or paying the investors or the government… aren’t counted. Nature sees all the kinds of impacts incurred by business decisions exactly the same way, though! It was our accounting community, going back centuries it actually seems, that decided to count one and not the other.
The omitted impacts are actually not hard to scientifically estimate for scale. That’s what Scope-4 accounting does. As you work with it you find more and more ways having the numbers right results in big changes the terms of discussion. The core scientific issue then, is having a metric that does not associate environmental impacts of business with the choices that cause them, but with the locations where the information is collected. That inconsistency may be as fundamental to economic accounting as to have originated in how business records were kept in ancient times on clay tablets.
The [ e = mc^2 ] LAW OF SUSTAINABILITY
ln(e) / ln($) = c
It says our growing earth impacts and growing earth economy are directly coupled.
The natural constant observed, [c], is the coupling of GDP and Energy use, as a measure of everything physical the economy does. It’s expressed as a ratio of their growth rates (here as a ratio of their natural logs). That coupling has been a constant [0.6] for a long time. You see it clearly in the figure below, showing a 40 year official world record for the economy’s growing Energy use and GDP.
It says that our increasing use of energy for altering the planet to make money grows only a little slower than GDP, at 0.6 times the growth rate of GDP, AND that this direct coupling has not shown any tendency to change over time! People imagine that ‘efficiency’ changes the coupling, but even with growing efficiency the ratio has actually quite constant. You’d need global efficiency in energy use to double every ~20 years like GDP generally has to really make a difference, so having growing value in a steady GDP is far more possible.
Of course, like e=mc^2, it’s not possible to tell quite where the natural constant observed comes from. That’s a big part of the scientific interest. Natural constants are emergent properties of the system, seemingly here a natural rate of societal innovation and adaptation, like a “natural learning speed”. The benefit of the constant is giving us a better way to measure inclusive sustainability, using the mathematical implication that:
— average shares of GDP pay for and are responsible for causing
average shares of GDP earth impacts —
The world economy grows as a whole, nob acting at all like the parts…
The power of this rule the direct coupling between responsibility for shares of Earth Impacts and shares of Earth GDP. It’s a measure that combines all the impacts of extracting energy and all the impacts caused by using energy, i.e. everything the economy does, with financial earnings from the economy. When the data is aggregated correctly, it allows a complete accounting of the GDP impacts, and “closed accounting” for shares of responsibility for them. So that for whole supply chains, one can measure their share of exhausting all our resources, forest and species loss, paving over productive land, etc. Delivering goods for an average dollar of GDP causes an average share of the whole economy’s impacts.
.
Scope 4 CO2 assessment
The science for applying this constant natural coupling of money and GDP impacts was published in 2011 in a research paper “Systems Energy Assessment” found at the SEA resource site. More detailed research notes are in the article What’s “Scope 4″. The physics is sufficiently general and inclusive that the same technique can be comfortably use globally, to assign responsibility for all impacts of GDP on the earth, and have a way to “internalize all externalities” that can start and remain valid as it is incrementally improved, as in “A World SDG“.
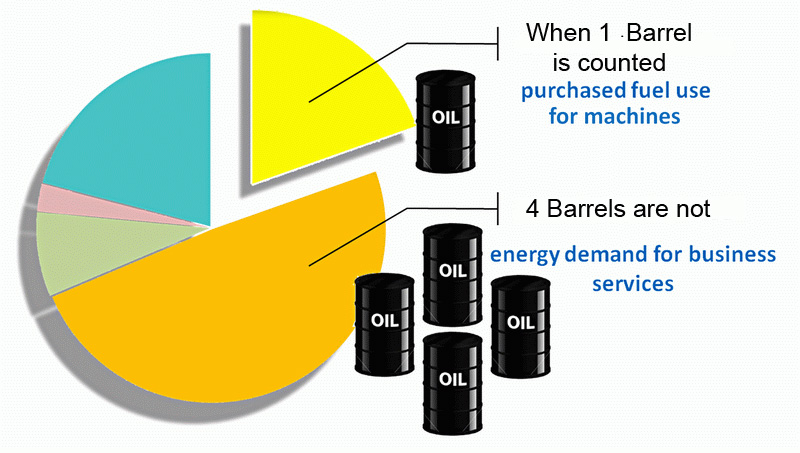
The SEA research study pie chart, 5 time the true impact causation found compared with standard method.
Discussion:
The real tragedy is that this bias in our business impact metrics assigns TOTAL responsibility for environmental impacts to the people who are paid to do them, who would not do them unless they were requested and paid for by someone else.
So then ZERO responsibility is assigned to the people choosing to request and pay for the impacts, communicating their requests for them by the transfer of money.
In criminal law, as when paying to have a crime committed, requesting and paying for it is considered the principle direct cause of the crime. The person paid to do it may be penalized equally or not. As far as physically causing economic externalities, in the court of environmental responsibility, it really should be decided the same sophisticated way.
What Scope-4 accounting does, then, is start from the complete list of things a decision pays for. It could become a tremendously long list, with lots of things only known from the money spent rather than from exactly how the service was provided. So for those you need to do research on what default assumption to make in case in case more detailed information does not become available. I’m still waiting for people to study it themselves and compare results, but I think the proof is completely convincing that absent other information the necessary default assumption is not “zero” but “average”.
Elementary technique:
If you get stuck in deciding what to count, just remember, businesses don’t pay for things except for business reasons, so you need to count *everything*.
You then think about the different categories of spending, and what their “direct” (material) and “indirect” (economic demand) impacts are.
The initial rough estimate rule for economic impacts is to count them at 90% of the world average per $GDP, like around 7000BTU/$.
Make sure you use inflation adjusted $’s and state the index year.
That’s easy to do, and lets you reserve your time for estimating the direct impacts, according to the added information you can collect.
So for the energy content of purchased fuels, for example, you’d count BOTH the direct energy content of the fuel, AND the economic energy impact of the spending, at 90% the world average. The reason is that the fuels come from nature, and the spending goes to people, paying them for the consumption they do to bring you the fuel.
If done correctly, the bottom line is a unique pie slice share of the world’s impacts
for delivering your share of GDP.
Another one to think through is how to estimate the impacts of retained earnings, used for either financial or business expansion investment. The economic impacts of that spending needs to be estimated with a multiplier over time… The whole purpose is to truthfully estimate the types and scale of consequences for our economic decisions.
More discussions can be found searching the journal or the web for “Scope-4” or “SEA-LCA” as interchangeable names for the same group of accounting methods.
Today our measures of business environmental impacts address the size and efficiency of business technology use, traceable from local business records. We’re not even trying to measure what’s traceable from what a business pays for throughout the whole economy. So in effect, the global impact is counted within a narrow local boundary, making the measures scientifically undefined, and highly misleading. Why it matters is that business, investor and policy decision makers then don’t know what impacts their decisions really have, and the research says most of any business’s real impacts are global. So we need to understand why the world economy seems to work so smoothly.
The world economy grows as a whole, as if all parts worked smoothly together, shown since 1970 here, and seems to have for 150 years, hard to imagine but competition seems to assure it, at least for energy use.
What’s counter intuitive for solving it is that the world economy not only LOOKS like a whole system, it also WORKS as a whole system. What you know is 1) all parts of the economy are supposed to be and 2) seem to act as if 3) they are competitively efficient. Otherwise 4) they lose their access to energy use, and the energy goes to someone else. Smooth working competition like that is 5) needed for a world system to work as smoothly as global data shows, and 6) making there no better assumption than that differences from global average efficiency are temporary. So unless someone can say why not, I think we have to treat energy use as being predictably proportional to GDP. That’s been peer reviewed as a general principle, that one can rely on the range of local or international variations being likely to be relatively small (maybe +/- 10%) for any globally connected part.
so…. there’s a LARGE miss-match
between the effects we see and the ones our money really causes
____________
Introduction –
the scientific basis for the SEA-LCA “SCOPE-4” accounting principle,
That: Every dollar spent can be shown likely to pay for such widely distributed services throughout the world economy, that at least as a first assumption, it also pays for an equal shareper dollar of the whole world’s economic activity and impacts. In principle, shares of GDP seem to carry equal shares of responsibility for what the economy does to produce GDP
The worst part of “A Glass Half Hidden” is the clear chance of discovering “An Iceberg of Risks” missing from the view.
Scope 1, 2, & 3 only count the impacts of the primary technology chains that businesses rely on to operate, and ignore the usually much larger impacts of the many chains of business services consumed too. That’s the iceberg of hidden responsibilities of business cause, being ignored due to using an unscientific method of measurement, i.e. counting only the impacts you see, and not accounting for the one unseen (what Scope 4 finally does). So there’s also a hidden iceberg of bigger than expected changes in plan to take care of too… that we’ve been unaware of needing for having a sustainable economy. It explains why our efforts so far still result in the economy degrading of the earth ever faster as we delay making meaningful change. The job doesn’t change, just how directly we’re able to address it.
What’s really hidden is that it’s our money that is directly paying for all the economy’s impacts, making us financially responsible. Now we also really need to know the total bill. Having a habit of not looking at what our money was used to pay for, we’ve been lulled asleep by the way money launders all the information on what our money pays for to deliver what the economy provides.
It is indeed a little ‘strange’ that a very basic scientific principle of measurement, that every scientist knows quite well already, would be overlooked in defining the world’s units of measure for saving the planet.
Scientific ways to measure things, need to measure the whole thing.
Sustainability metrics very largely don’t so that, lacking a scientific way to determine the scale of hidden impacts, the method for measuring economic impacts defaulted to the ancient practice of just counting what you have direct information on. The reality is that the great majority of business impacts actually don’t c come from what is most visible, but from widely distributed uses of the economy that businesses have no records of, paid for by employing all sorts of business services. The problem is that whether you know about them or not, the risk exposure to serious emerging economic liabilities… is exactly the same.
Here’s a new graphic to help picture the problem. It helps to shift from thinking about counting the energy “uses” a business and its suppliers operate with (i.e. traceable for Scope 1,2 or 3, and so on the visible side of the “glass half hidden”), to thinking about the energy uses its revenues are “paying for“, but often don’t have records of (Scope 4, on the hidden side). It’s the total of energy uses paid for that make a business both financially responsible and directly exposed to the emerging economic risks of physically causing economic liabilities and the harms done. It’s a serious major overlooked sustainability business risk. If 80% of the CO2 produced by uses of business revenue actually come from its services, and not its technology,
…it’s all the same to the investor exposed to the risks for the business as a whole.
For risk exposure it’s essential to measure the total impacts on the earth a business is financially responsible for, as that’s where the risk comes from. Just choosing not to count all the ones your revenue goes to pay for moves the risks to the hidden side of the “glass half-hidden”… but still leaves you just as exposed to the very substantial economic risks of business devaluation many see ahead. Continue reading How full is a “Glass Half Hidden”?→
I had found a cozy place to work on sustainability from inside the UN, but discovered the words holding the discussion together there had accumulated meanings that were deeply dishonest… so I’m back on the outside.
___________
Over the past year I developed two rather wonderful scientific learning methods, as if school courses in “Niche Making 101, 102”, for people searching for how to work with nature. One is the 3Step method for learning how your economic commons works and the other the World SDG for making the totality of our growing impacts on the earth transparent to each other. Both were very unexpectedly attacked rather than discussed in the organization I was part of, though, and I’m understanding the offense.
After much suffering, puzzlement and close observation, the harsh reaction to learning by a scientific approach now seems due to it not being sufficiently ideological. Unfortunately… letting up on the ideologies we may use to stamp the world with is the very first rule for learning from nature. Finding that people both didn’t seem to know that, or to be willing to try, is an important lesson I wasn’t prepared to learn, especially that my own social network would respond as if attacked by my suggesting good creative ways to do it .
Ideology is an artificial and inflexible but handy social substitute for reality. By definition ideologies are self-defined, built up as social affirmations in well connected networks. It makes them strong but also largely unable to adapt and respond. For people they provide mental comfort, useful knowledge of group habits, and a private coded language only understood in the network.
How ideologies can open up and become adaptive we often fail to notice, though, how often we naturally change from one to another in the course of a day or week as we engage with different networks. We change ideologies much as if putting on and taking off clothes, often using a change of clothing to do it in fact. So,… it seems sensitive, but need not offend, to notice that ideologies need to be suited to situations and to grow and change with them, letting us try on different ones for fit. Ideologies can be temporarily considered as “nice outfits to wear”, and need not be treated as contracts required of others for whom they don’t fit.
Sadly, the dishonest words this viewpoint helps us understand are some of the favorites in the discussion of sustainability. They’re ways of mixing honorific images of ever accumulating wealth and reducing our footprints on the earth: “sustainable growth”, “decoupling”, “circular economy”, even “sustainable development”. They’re frequently used to compare “apples and oranges” and coming up with “ever increasing consumption without consumption”. With that usage our goal and purpose becomes to accelerate the “tragedy of the commons”, that is our whole discussion is about how to avoid.
How you can tell that for yourself is by observing that putting the contradictory meanings of “development” together requires switching back and forth from one ideology to the other, with that switch not being mentioned. It shows that people, in conversation, are adopting an ideology of hiding when they switch ideologies. Sadly that seems what we have socialized around doing, unaware of the consequence. At present nearly anywhere in the global sustainability movement you go (and I’ve really looked around!), you get strong pushback for even trying to bring it up.
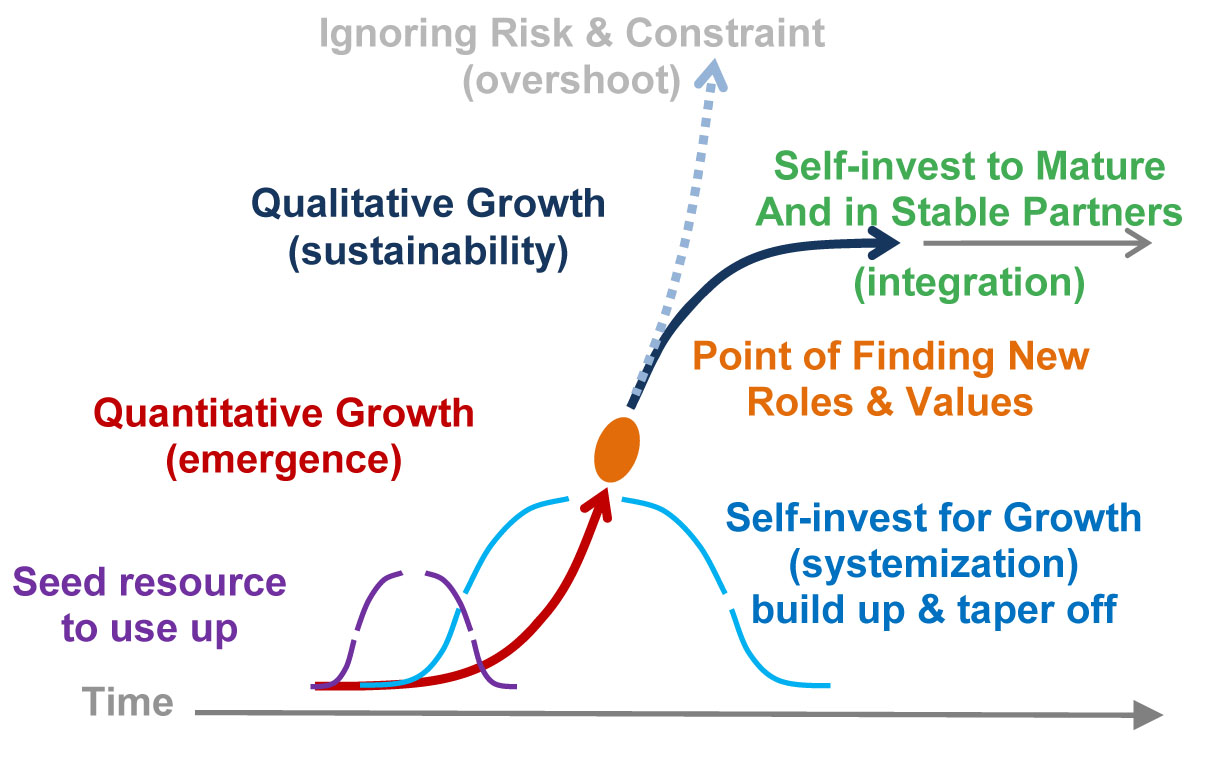
The natural succession of growth and adaptation for sustainable systems, a complex organizational development of internal and external relationships.
Nature doesn’t respond to artful ideology in the least, though. Not one little bit. What nature responds to is the growth of new organisms that change from expanding their conquests to then making their niches. That succession is their (and our) door to joining the commons by making their (and our) homes in it. Feel good euphemisms for the opposite, stitching together our true ideals into fig leaves for endless conquest philosophies like BAU, actually don’t work.
No need to take off our clothes in public… but dropping ideological fig leaves at times
seems required for how we learn.
Offering a true measure of economic sustainability, internalizing the costs of externalities caused by delivering world GDP, initially using shares of GDP to measure shares of GDP impact responsibility; potentially making the world economy 100% accountable.
It’s the “right way to make money”, taking responsibility for the true shares of our costs to the future.
Investing and doing business in the common interest,
…calls for balancing costs and benefits, no longer just counting operational impacts locallyas before, adding up only the impacts over which we have direct control (and can’t hide). Now we need to do impact accounting inclusively, combining in one account both direct operational impacts and direct economic demand impactsestimated as our global shares of the GDP impacts we pay for. That’s the essential step to inclusive accounting, and balancing our benefits from GDP with our real shares of responsibility for the whole economy’s accumulating GDP impacts. It’s needed to guide our choices for moving toward a sustainable future.
To apply it we need to recognize that the supply-chain and service-chain impacts are a *shared responsibility* of the those managing the operations the result from, and the economic demand caused by paying for them. Now the World SDG offers a scientific method for measuring the responsibility of economic demand. Businesses and investors need to make sound sustainable decisions about supply chains reaching around the world, and need accurate information on what is being paid for and profited from to do that. Consumers, shareholders and regulators can then also make sound decisions about what the markets are profiting from. For the glaring cases, regulators could variably tax the profits from dangerous impacts, funds to be transferred to subsidizing the profits for scaling up alternatives, making the investor and buyer jointly responsible with the seller for the important side-effects of their economic services. In principle both buyer and seller are co-equally responsible, liable for long term costs of short term profits, and for being transparent. This way of doing the accounting would help pave a clear path ahead for the economy of the future. 06/26/17, 11/5/18
______________________
Updated Preamble to the 2014 UN Proposal
Following these notes is the original text of the World SDG proposal, to the UN Ministerial “Open Working Group 7” and the UN NGO Major Group and its Commons Cluster, for negotiating the global Sustainable Development Goals (SDG’s). It offers a “whole system accounting” method to give all stakeholders the same transparent information on measurable Environmental, Sustainability and Governance (ESG) impacts of the economy, to help guide economic choices for our future. What makes it work is a new scientific method for much more accurately distributing real responsibility of economic decision makers for their decisions. That new science, for how the world economy works as a whole, is what allows all stakeholders to see their own and each other’s real scale of impacts on the whole caused by their economic decisions. It becomes a learning tool for then guiding our choices for the benefit of the whole, creating a holistic awareness of what’s at stake for consumers, business, investors and governance, and guide efforts for achieving the SDG’s.
Latest 2016 research statements, The links below are to recent UN Statements regarding how our standard ways of measuring sustainability are very selective, and leave the great majority of economic impacts on our future uncounted[1,]. My recent video comment to the UN [2,] on this grand accounting problem is in the webcast of its high level political policy forum for sustainable development (HLPF), its July 11 Session 4: Fostering equitable growth and sustainability . Watching the hour of statements from many experts, countries and organizations will show you how the UN works, and avoids discussion of our ever expanding impacts. My statement is at minute 0:40:40, and others by Youth, Women & Indigenous Major Groups are at minute 1:09:00 to 1:21:00, and quite excellent too.
Our modern environmental accounting standards were based on ancient habits of not counting things we can now measure the effects of. The is largely limiting the information given decision makers to LOCAL impacts, and leaving uncounted their real shares of the GLOBAL impacts. These categorical omissions from what is counted assure that businesses, investors, government and consumers will make sustainability decisions quite unaware of most of the impacts their decisions will cause. What is excluded also tends to be the more neglected and disruptive of our accumulating economic impacts on the earth and society, and so excluding consideration of them in making the decisions that cause them. So sustainability decisions to maximize profits can also be maximizing neglected impacts too!!!
We’ve never had a meaningful balance sheet for the earth, but new science and technology now makes it possible. Our accounting methods started from doing local accounting of impacts, and so didn’t take a whole system view, and that’s still the case. So leaving them out of consideration means it’s only slowing the whole economy that slows its increasing whole effects that are continuing to destroy the earth.
I) The standard way ‘sustainability’ is now measured uses “selective accounting” rules, for addressing ESG impacts, for people, businesses, cities or countries or policies. It’s to count things almost entirely only for what each one directly manages. That counts what each planning group would immediately care about, but it ignores the often much larger remote effects of their commerce on others and the planet, a very deceptive one sided view. For businesses energy use, for example, what is counted is only the energy within its operations, for its equipment and the material uses it manages, or directly traced to them. Even though doing that takes a great deal of effort, it arrives at a total that is highly inaccurate and misleading, due to the more dispersed categories of impacts uncounted.
II) The most general exclusion is of all impacts of financial choices, all treated as ‘zero’, though also very clearly resulting in what is paid for and profited from, by consuming all the services of the economy remotely. The largest part of that exclusion is the financial choice made by businesses to pay their own people, and so economically causing the consumption. Business use of public and private services, and paying investors are also excluded. Also excluded are all those categories of paid services impact for business supply chains. So given that we are now relying on environmental accounts for saving the earth, it’s evident that no one before had been checking what decision makers would be told they were making decisions about.
III) To make real decisions on sustainability decision makers would need to accept co-equal responsibility for their choices to request, pay for and profit from their share of impacts for delivering their share of GDP. Because our responsibility for what we see happening around the world is not traceable you need to count it statistically, and the new research makes that relatively easy. It gives co-equal responsibly for directing the work of a business supply chain with the operations of the supply chain.
The original research (3, 4) found the whole supply chain energy consumption and CO2 pollution of 5 times what the Life Cycle Assessment (LCA) or GreenHouse Gas (GHG) “Scope 1&2” metrics would count, using a wind farm business with heavy technology as model. For less for businesses using less heavy technology, the true impact might be 10 times what is counted, with the more disruptive remote impacts going completely uncounted. The old rules were inherited from practices for simplifying accounting and ignoring things that were hard to count. It reflect the oldest of old habits of thinking, of economies working with separate parts, when since Adam Smith everyone has known they work as a whole.
IV) The World SDG proposes a data network giving access to a transparent inclusive accounting of measurable ESG impacts, a data platform. The starting point is a scientific method of dividing up shares of known impacts of the whole economy, for which any part would be responsibility. The baseline for estimating a share of economic responsibility is the decision maker’s share of the economy, initially counting every share as “average”, and then differentiating if more information is available. So as an impact calculator, any person, business, or country would enter their “income” and first see a display of the known global impacts for that share of world GDP. It would be for helping them choose how to invest their time and money, and guide policy. As research develops, ways to depart from average and take credit for lessening or compensating for impacts would develop.
The principle strategy for the World SDG is to improve the decision making regarding investments, thinking of “investment” more holistically, as both “cultural development” and trying “new directions for the economy”. For operating businesses its ESG balance sheet report would be published along side its annual financial balance sheet report. All stakeholders could view the same “best available information” on all impact factors. When a new investment proposals want public recognition and perhaps qualify for support, they’d go through public reviews. First would for general scientific and economic feasibility, then financial, and then for cultural acceptance and political commitment. From initial to final reviews it would proceed as a “learning practice” going from early concept to final implementation stages. More successful proposals might be seen as “transformational” and become a teamwork of all the stakeholders, not just the initiators.
Our main sustainability impact metrics (2)
LCA (Life Cycle Assessment) accounts for the impacts of recorded uses of technology and materials by individuals and businesses
but not the impacts of OTHER spending and economic choices
EF (ecological footprint) measures our traceable use and flows natural and renewable resources
also not the impacts of OTHER spending and economic choices
The World SDG method combining the omitted economic impacts with scientific measures (3)
EI (economic impact) measures accumulative responsibility of participants in the economy for shares of global ESG impacts of GDP, assumed to be proportional to shares of GDP until improved information is available.
Share of GDP is a reliable measure of our use of the economy, on the currently reliable assumption that the measured economy works as a whole, based on the highly regular relationship seen in the first figure below, of a constant ratio of constant whole system growth rates for GDP, Energy & Energy Efficiency. Also see the Addendum – Background on the Science and references (4, 5a,b)
______________
Preface
Why a World SDG is both possible and needed is because our world economy works as a whole. We need a truly global way of understanding the impacts of our decisions, to crate a “Knowledge Commons for Sustainability”. We recognize that every part contributes to the whole and no part can operate without the whole. The surprising result of the research is how reliably any share of GDP is likely to be “average” and pay for about the same share of world GDP impacts (4). 1) It first comes from how widely distributed consumption spending is, then 2) how widely money from any expense is distributed in the global economy, to all income levels within all kinds of businesses, as it is passed down a supply chain(5a,b). It then also relies 3) on how truly global and competitive economic markets and services are, with all parts being disciplined by the same competitive standards for profiting from the resources everyone has access to. So the baseline assumption that shares of GDP pay for the same average share of GDP impacts is both necessary as a default choice and likely to be accurate. Making decisions on how individuals and the world can depart from average would then become the focus.
Everyone could then understand their own benefits from the economy and how they compare with the global impacts of delivering them, seeing the simple facts in a broad context. For example, a 6 oz (180 cc) glass of wine for $10 seems like a small impact. As an average share of GDP what we find is $10 is quite likely to have an “average climate impact” of .45kgCO2/$ = 4.5kg for $10 = ~10lb x 16oz = 160 ozCO2 [2006 data] (4). So the weight of CO2 consumed would be ~27 times the weight of wine. The catch is that spending $10 on anything else would be the same. How we use any part of our incomes would be close to having an average share of CO2 AND other global impacts of the economy as a whole, soil loss, deforestation, environmental and cultural disruptions etc. [for 2016 data due to inflation and efficiencies impacts per $ are ~66%]
So the World SDG accounting model lets you:
Compare our shares of World GDP benefits with our shares of its measurable Ecological Societal and Governance (ESG) impacts.
Using “shares of the whole” as a common unit of measure for responsibility for the whole
by aggregating reliable measures of human impacts and risks to our future, including direct financial liability if there are good estimates
using the sound initial baseline assumption of “average responsibility per share” pending more complete accounting.
It would provide an accurate accounting for the modern world’s survival on earth. [ed 8/23/16]
… a scientifically combined balance sheet for financial and ESG factors, so people can better understand our economic choices.
___________________________
.
A World SDG
A World SDG is a “commons approach”
Full accountability for the rising economic costs of an unsustainable future
Finance motivated to invest in the SDG’s close to our hearts.
An integrated balance sheet of local and global responsibilities for integrated implementing of SDG’s.
New science makes it possible to give those who profit from growing our costly economic impacts the information they’d need to understand their growing global liability. What would be more profitable choices for all can then reverse that. It’s shocking, really, when one finds what a $1 dollar share of GDP (where the averages apply) is responsible for, as a $1 share of today’s economy’s fast growing impacts. Every average $1 of GDP is responsible for close to 1lb of CO2 put in the atmosphere! So in a sentence you just replace “dollar” with “pounds of CO2” to speak about the climate impact of normal earning and spending. For a consumer with a $50k income, the climate impact is 50k pounds of CO2 per year!
Parallel growth rates for world GDP, Energy, CO2 and Efficiency => make average shares of GDP responsible for the same share of those parallel impacts.