|
- learning what the measures means – World GDP in moving pictures
Because “comparative advantages”
=> “cooperating specializations” we get: (A Shorter Research Journal Entry for Fig’s a. & e A World View of Off-Shore Energy use )
|
|||
|
|
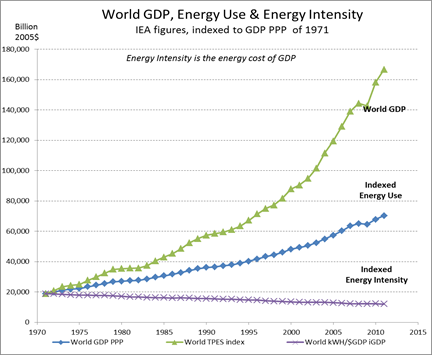
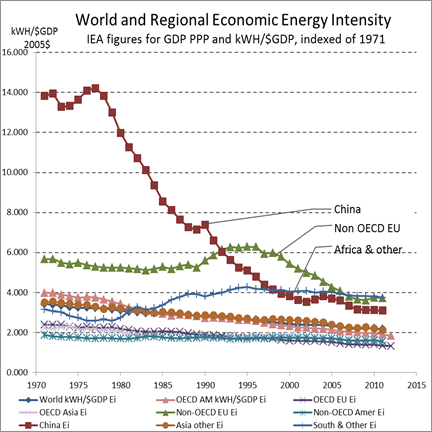
a. The World economy has been working smoothly as a whole system · continuing it’s long historic path of steadily declining energy intensity, growing energy use and faster growing GDP
(note: Indexed curves show relative change from a point in history, not where history started! Other studies do suggest that this simple pattern extends well into the past) - Q’s or Error reports to: eco@synapse9.com |
||
|
|
|
||
|
|
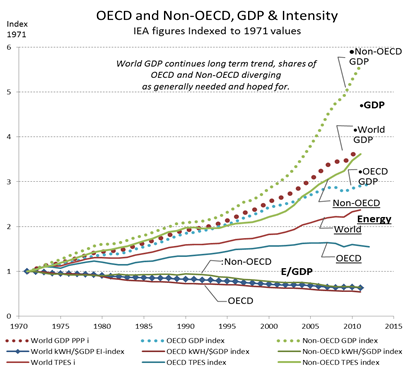
b. There’s also a simple difference between the leading OECD group of economies and others compared. · The growth of the OECD countries has slowed since 2000 · Non-OECD countries picked up, ·
So the World as a whole has
continued growing as before!! Before that, for a few years around 1990, the Non-OECD countries had both slowing growth and slowing decline in energy intensity (efficiency) · World data often shows GDP slowing for recessions, as if periods of “retooling” too. · One set of systems may be being replaced by others, and later taking full effect as seen in later accelerating growth. |
||
|
2. Price is such a sensitive indicator of competitive advantage, no country would prosper if others doing the very same thing were more efficient. So “doing something different” for “comparative advantage” lets economies select the needed talent of every part does best. All economies end up using their common resources, like energy, to “equal advantage” for generating GDP **for their role in providing complementary services to others**. |
|
||
|
|
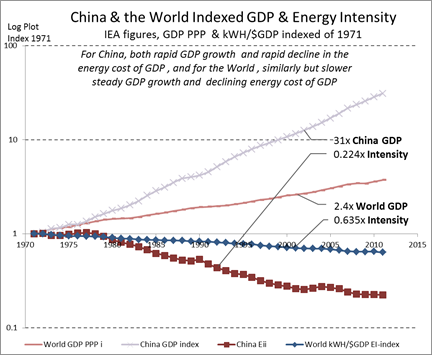
c. To understand differences in economic outcomes one can, then, assume all are or will be rapidly moving toward, using energy with comparable productivity, at the now world average, · World avg GDP Energy efficiency 5.8 kWH/$GDP 2010 w/ then current $ · Notice how smooth and straight the growth and efficiency improvemen trends are · China’s unusualy rapid growth and rapid rate of reducing energy use per $GDP, leveling off a bit for 10 yr |
|
|
|
|
|
|
|
|
|
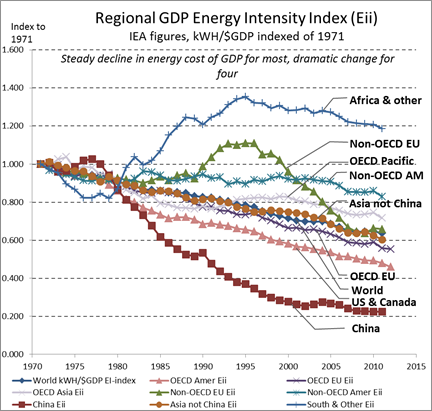
d. The energy intensity for all 8 major sectors of the world economy shows three groups. · Large changes for, ‘China’, ‘Non-OECD Europe’, ‘Africa’ toward ~3.75 · Steady slow decline for two groups o World average tending toward ~2.0 also for ‘Other Asia’&‘US & Canada’ o Tending toward lower ~1.3 for ‘OECD EU’, ’OECD Asia&Pacific’, ’Non-OECD Amer’ Every country needs to be competitive with others in using energy, so each group must have a complementary but different role in the world economy. · I. The economies specializing in energy intensive services for the major economies · II. & III. The economies secializing in things other than energy services
|
|
|
|
3. The differences between the three groups are displayed in e. The ratio of their share of the World’s GDP to their share of the World’s Energy Use f. The ratio of their Energy Use to their GDP |
|||
|
|
e. The countries that profit most from their share of the world’s energy: · The two more efficient groups of OECD countries, EU and Pacific · & surprisingly, Non-OECD countries in the Americas, like a “halo” benefit of being near the most wealthy (and wasteful) of the OECD countries. The countries that profit least from their shares of the world’s energy: · Seem to be all taking differernt paths toward the same ratio here too, but quite differently than in fig d. … · It suggests that further inspection and study of events during the pivotal times of change would help explain.
|
||
|
|
|
||
|
|
f. The countries that seem to be providing energy services to others are split here between, · Large decline in intensity for China’s dramatically rapid industrialization, focused on getting the business first and making it efficient later · High degrees of variation for the other high intensity group (from d.) plus Non-OECD Europe. o Each would have a complex story o Maybe about trying to immitate China, or like Africa, having the development of energy servies for others quite outweigh other development. |
||

|
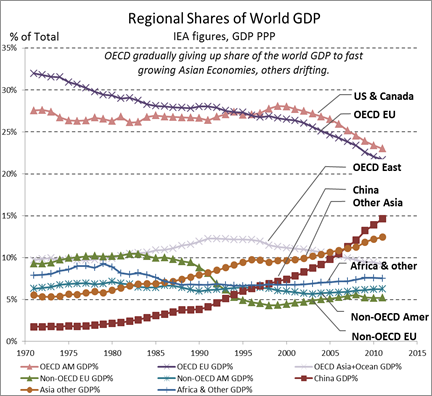
4. The familiar groupings of “big” and “small” sectors is shown here, in “shares of World GDP”. That is then compared to the “shares of the World Energy Use”. |
|
|
|
g. The main GDP share trends are: · The leading US & EU economies along with Japan & Australia as Asian OECD countries are steadily losing shares · China & other Non-OECD Asian economies gaining dramatically · Both African and South American economies remaining constant. · A rapid decline in Non-OECD Europe in the 90’s needs explanation.
It’s speculative, but the kind of reserch suggested, to wonder if the variable GDP of Africa, showing recent decline in world share could hide things. Might modern development efforts be under-performing like past ones, bringing profit to outsiders and little else? |
|
|
|
|
|
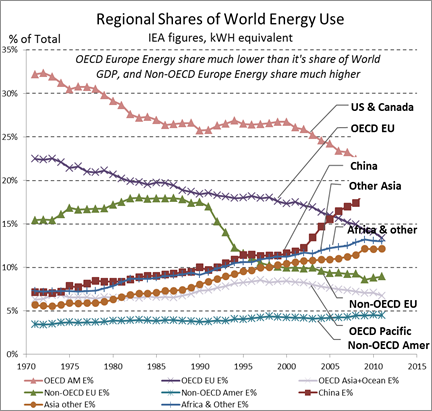
h. The main comparisons with the Energy share trends are: · The dramatically smaller amount of energy use the EU countries need to produce their large share of GDP o It suggests that they are considerably better at using offshore energy services compared to the US & Canada · The “unsteady” fluctuation of Africa’s progress seen in other charts is here a very stead and rapid rise in its share of energy use, doubling, adding to the question of whether it is benefiting from providing energy services to others.
Ó JLHenshaw Synapse9.com |
|
5. (old draft) The familiar groupings of “big” and “small” sectors is shown here, in “shares of World GDP”. That is then compared to the “shares of the World Energy Use”. |
|
|
|
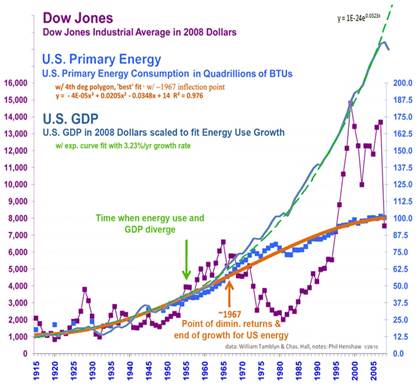
I added a line for US GDP to the nice graph of US Quads of energy use & Dow Jones prices done by Charlie Hall (1). It’s remarkable. It seems to expose a bit of a “fraud” in what people have been told of the role of the stock market. Clearly both GDP and energy use have generally followed smoothly progressive curves. Clearly the Dow doesn’t track or lead either. |
|
|
|
|
|
There’s
a lot more to why US energy use stopped growing and GDP kept growing, but the
DOW really seems to be just sailing off on its own. It reflects no
aspect of either of the consistent indicators of economic wealth.
|
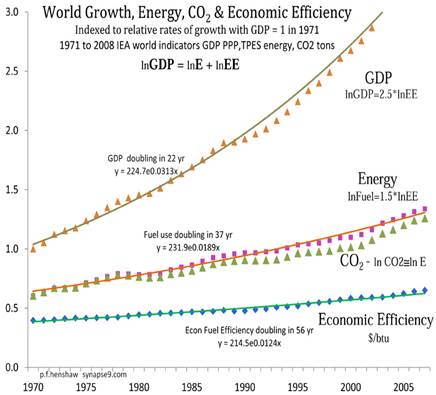
For the world, the relative growth rates of GDP, energy, and the ratio of GDP to energy (called Economic Efficiency), are constant over the last 40 years. So something else must be going on to explain why US energy use has not been growing. The problem with understanding it all starts with nature being so full of things that behave by themselves. Natural systems are cells of organization for using energy, that independently organize themselves as they grow from the inside.
|
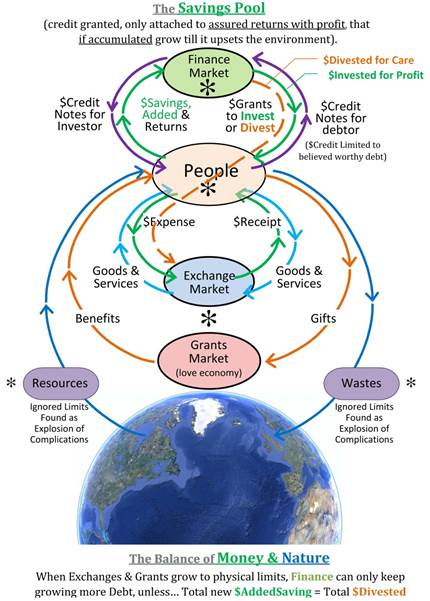
6. (old draft) Physics doesn’t accept that model of nature, so it’s not taught in school. It makes us quite handicapped for studying them, as the internal organization of cellular systems is generally invisible to outside observers too. The choice seems to be The best starting point seems to be to mentally connect the natural succession of growth with the cells of organization that develop by growth. For growth to work, growth systems have both a “working process” and a “seeding process” to pump up more, like population growth works. That seeding process is what changes at the limits, or the whole process fails. I’m showing the economy as the bubble called “people” in figure 3, and the exchange of products and money from person to person through markets, “money market” and a “consumer market”, just to keep it simple. How the economy grows is by finance acting a bit like a farmer who plants more than he needs so he can plant more each year. |
|
|
|
That grows to exhaust its resource, of course. The solution that Keynes identified, is for finance to stop planting the extra seed, as not doing would end by making the whole economy unprofitable and like an overplanted field, limited die off’s instead Communicating that turns out to be difficult, for the above reasons, as well as that people often think having their own opinion is equivalent having well grounded insight into how the complex natural world works, which it not correct. That’s as good a condensation of what I think I’ve found out on the subject myself, anyway. If you want to look further into my approach you might just browse my site, or start from “Why finance has a bigger appetite than the earth” and follow links to the various discussions.
Ó JLHenshaw Synapse9.com |