
Gamma ray bursts are the most high energy events commonly observed in the universe, associated with the formation of “black holes”, and creating very high energy x-rays. NASA provides good introductory information with a nice animation. Satellite instruments easily record the time and intensity of these events but can only rarely connect them a location. So they’re one of the more mysterious of cosmic events, also common and occurring a few a week.
This journal entry in RNS updates a very sketchy old record of my 1998 study to demonstrate an “Application of the Physics of Happening” using my powerful new analytical method called “derivative reconstruction“, for exposing the active dynamics of phenomena of all kinds, that may be hidden in noisy data. It was published with other new techniques in 1999 as Features of derivative continuity in shape, in IJPRAI.
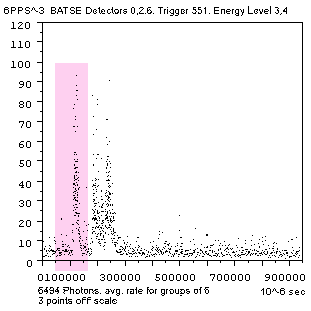
The 1998 gamma ray burst study was of the data from NASA you see in the figure below, called “BATSE Trigger #551”, using the 6494 points recording gamma rays in Energy Levels 3 & 4, chosen for being less noisy. The object is to reveal the detailed shape of any underlying continuous processes involved, as seen in the second figure. To date, it seems, gamma ray bursts like this are only understood as statistical events, like “bursts of noise”, instead of as dynamic events with continuous processes .
You can see below the clear dynamics of the first of the three major burst events in the record, consisting of a sudden rise without evident developmental processes, followed by an abrupt shift to declining by a regular “S” curve progression, of the decline first speeding up and then slowing down. That connection of two highly differing dynamics is something like the “bursting of a bubble”, with the breach of the containment and the release of the pressure having very differing dynamics. That analogy may not apply to black holes, of course, but understanding two different dynamics is likely important to understanding what is physically occurring.
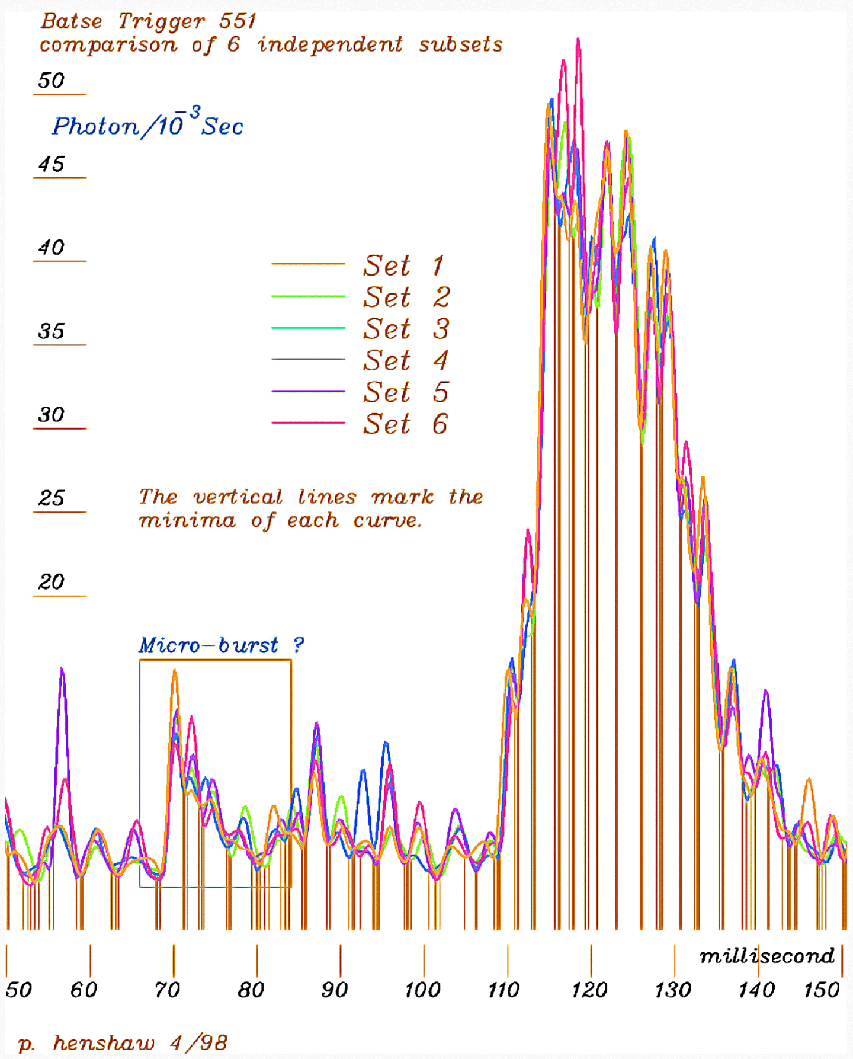
The other highly noticeable shape exposed is an apparently fairly regular 3 millisecond fluctuation in the cosmic gamma ray background. As to whether is a feature of the data or of the analysis, one can see it is both quite regular and irregular enough. The regularized curves are shown in six colors, each one representing the same derivative regularization applied to a different subset containing concurrent 1/6th’s of the whole data. The vertical lines mark minima for every fluctuation in each of the regularized subsets. Continue reading Gamma Ray Bursts – dynamics reconstructed