Derivative reconstruction (DR) constructs smooth curves that are simplified representations of trends, like running averages, but causing much less distortion. Finding similar dynamics in two measures indicates a likelihood that the underlying physical systems are connected, and provides testable propositions for further inquiry. A more thorough study might reinforce the appearance of the preliminary analysis below, as several others have, or reject the appearance for some other.
DR is used here as a simple refinement of very basic data inspection techniques. The curves shown below are based on ordinary running averages of well callibrated physical measures. The incremental refinement involved is to regularize the higher derivatives. This produces a curve which follows very much the same path as the running average, but has a derivative without spurious fluctuations. Spurious fluctuations prevent subtle changes in direction in the underlying processes from being examined. Using this approach completely unexpected behavioral structures are often found.
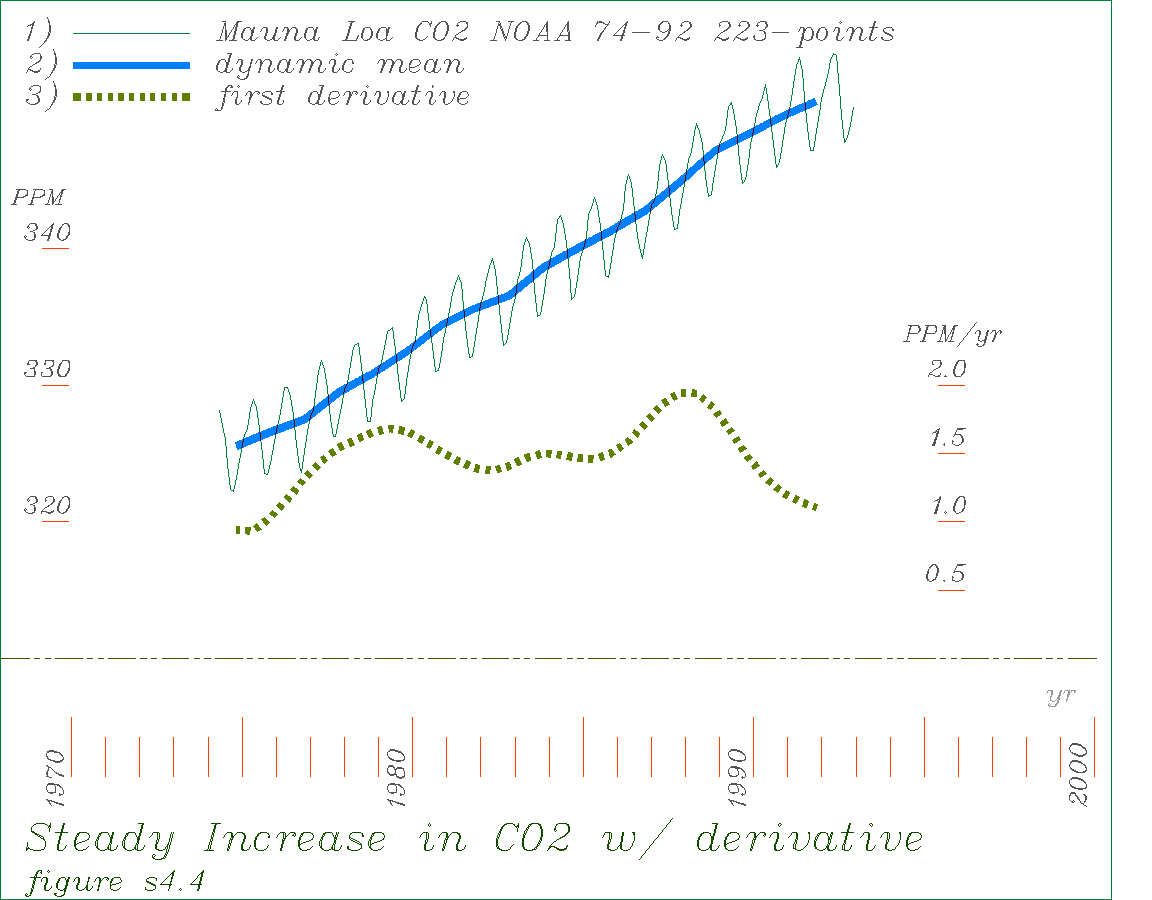
The portion of CO2 in the atmosphere has varried over geologic time, but never at rates like today. Today the rate of CO2 increase in PPM/yr is about 1500 times greater than the steepest rate found in the Antarctic ice core CO2 data. The timescales of the measures are quite different, but the ancient trends display extraordinary smoothness over long periods and this strongly suggest that significant transient departures from natural sources did not occur. The graph below shows the monthly atmospheric concentration of CO2 on top of Mona Loa in Hawaii from 1974 to 1992, the derivative smoothed running average, and its first derivative. The data shows a regular annual fluctuation (high in the winter) and subtile year to year changes that might appear completely insignificant unless the curve is made smooth enough to allow calculating its long term derivatives. The derivative shown here displays the lags and accelerations of the overall trend quite clearly. They do not display recognizable dynamic structures (such as exponentials or regular oscillations) but if the same shapes appear in economic or climate behaviors it would indicate a possible linkage. The fullscale chart shows more of the detail, and the data file for the curves also provides information on the data sources and the complete sequence of the operations used.
The temperature of the earth over the same period has varied in a much more complex way, showing two major medium term scales of fluctuation in addition to erratic annual fluctuation. Not shown here is a still longer period fluctuation visible in the earth temperature records of the past 100 years. The dynamnic means shown here are derivative smoothed running averages of two kinds, for 5 month and 73 month periods. The first derivative shown is of the larger scale trend. The fullscale chart shows more of the detail, and the data file for the curves also provides information on the data sources and the complete sequence of the operations used.
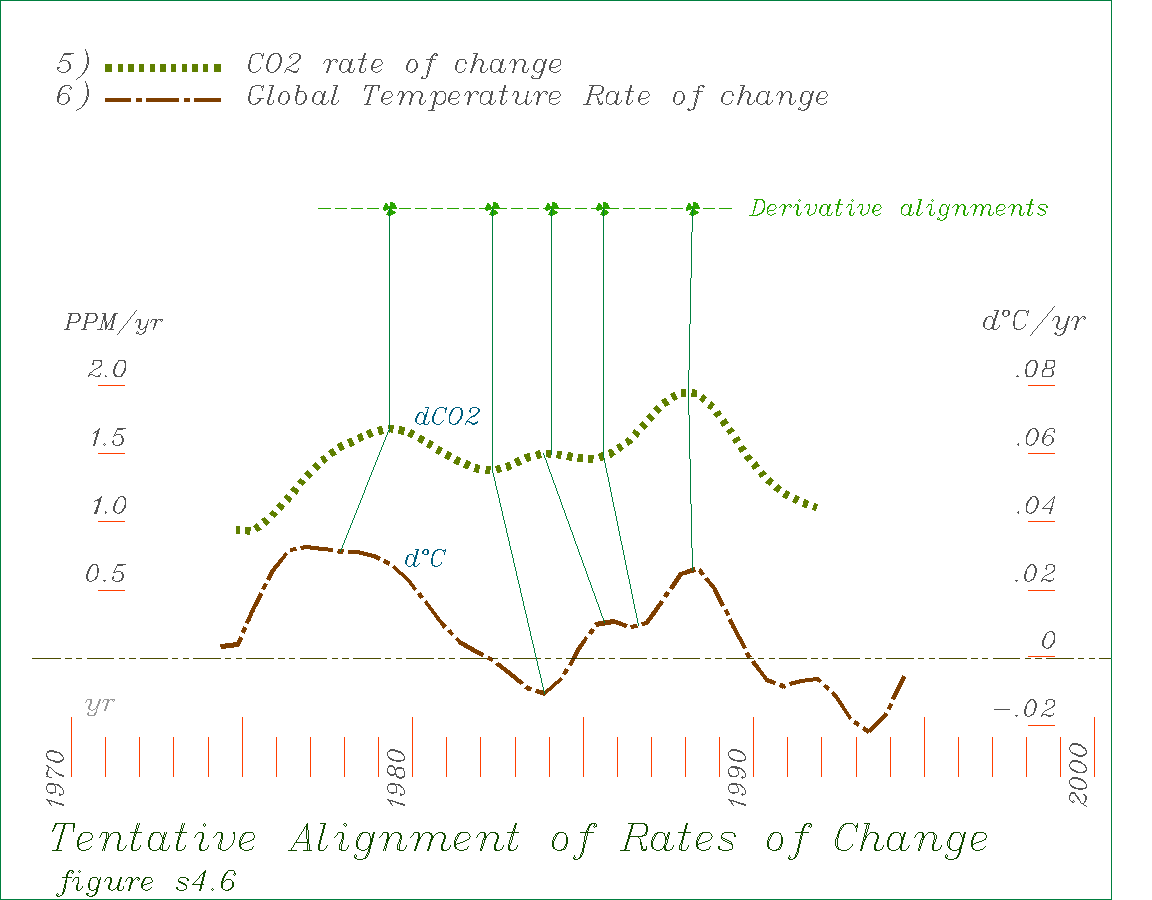
The two derivative curves are compared below. The dynamics appear to consistently mirror each other in relative trend, scale, timing and general shape as well. That the data are from completely different sources and have such closely matching characteristics makes coincidence seem quite unlikely, strongly indicating a direct coupling of some kind between the underlying physical systems. The somewhat irregular alignment of turning points could have various sources, with imperfect analytical procedures and imperfect coupling between the physical systems most likely. It remains to be determined, what the actual nature of the coupling is. The basic requirement is for some mechanism that would cause the rates of change of the two measures to be related, irrespective of their magnitudes. It's not an easy question.
The most curious thing is that earth temperature is shown to be declining when the rate of increase of CO2 is below about 1.5 PPM/yr, even though CO2 concentration is still increasing. This can be expressed in the approximate relation (dC /.04 = dCO2-1), describing the scaled rates of change as differing by a constant. This is a form of differential equation you would hardly expect. It either says either that 1) the rate of increase in temperature is related to the rate of change of CO2, but not the amount, a strange idea, 2) that the rate of CO2 increase is controlled by earth temperature, an equally strange idea, or 3) that the matching dynamics in the measures reflect corollary movement in some other more dominant causal factor and are (in the present domain) otherwise independent. The question is what could that be?
This does not agree with the simple greenhouse effect hypothesis. It is as if the climate system, and its independent dynamics are dominant, and presently able to accomodate a certain rate of increasing CO2 without increasing temperature. Up to that rate of CO2 increase other means of heat transport in the atmosphere respond to compensate and the otherwise expected temperature increase is suppressed. If that speculation were accurate, a continuing increase in CO2 would eventually exhaust the resilliance of the climate system and its ability to accomodate it, and temperatures would then rise continually and more rapidly.
A speculation with a little more direct support is that the impacts of CO2 warming are presently being compensated by the unknown larger scale climate change forces. The mechanisms underlying the longer period fluctuations (possibly solar cycles or long period self-organizing behavior) look like they would be moving us into a long term cooling trend. This may be partly suppressing the effects of greenhouse warming. Given that these are new questions about a very dynamic, complexly organized and not well understood natural system, the only firm conclusion that can be made is that the data indicates that the climate is doing something very unexpected..
fullscale, (for data see above)

To firmly associate human activities with the apparent CO2/temperature link a connection between economic activity and CO2 is needed too. I have not been able to find the correct data for that at present and would welcome any suggestions.
P. F. Henshaw ph@synapse9.com
Deravitive Reconstruction Main page, back to the top
P. F. Henshaw ph@synapse9.com